
EDUCATION POLICY INITIATIVE at CAROLINA 1
edTPA in North Carolina: Early Evidence on Candidate
Performance and Predictive Validity
In this research brief the Education Policy Initiative at Carolina (EPIC) examines the edTPA performance
of UNC System candidates and assesses whether edTPA scores predict early-career teaching outcomes.
This evidence is particularly important as North Carolina prepares for the statewide implementation
of edTPA. EPIC finds that: (1) the edTPA scores of UNC System candidates are comparable to national
averages; (2) candidates with higher edTPA scores are more likely to secure teaching positions in North
Carolina public schools; and (3) candidates with higher edTPA scores have higher value-added estimates
and evaluation ratings. These predictive validity results are positive for minority and white candidates
but differ across state achievement tests and for graduates of certain institutions. Future research
should continue to examine edTPA as a key data point for program accountability and growth.
Introduction
Beginning in 2019, North Carolina will require all those
seeking an initial teaching license to submit passing scores
on a nationally-normed and valid performance assessment.
Unlike traditional, knowledge-based licensure exams
(e.g. Praxis II), performance assessments are often
completed in K-12 classroom settings and are designed to
authentically assess candidates’ readiness to teach. In North
Carolina, many teacher preparation programs (TPPs) are
preparing for this requirement by integrating edTPA into
their coursework and student teaching. edTPA is a widely
adopted performance assessment—in use by nearly
800 TPPs in 40 states—that focuses on candidates’
planning, instruction, and assessment skills.
In advance of this performance assessment requirement, it
is important for TPPs and North Carolina policymakers
to examine how teacher candidates are scoring on edTPA
and to assess whether edTPA scores predict outcomes for
early-career teachers. At the university level, this evidence
can help TPPs meet accreditation requirements and make
data-driven program improvements. At the state level,
this evidence can inform program accountability and the
establishment of a passing threshold for licensure.
The UNC System is addressing the need for edTPA
evidence through its on-going research collaboration with
the Education Policy Initiative at Carolina (EPIC). As
part of the 2017-18 scope of work for the UNC Educator
Quality Research Initiative, EPIC is partnering with select
EDUCATION POLICY INITIATIVE at CAROLINA 2
UNC System institutions to accomplish the following:
(1) detail the edTPA scores of teacher candidates;
(2) assess whether edTPA scores predict entry into the
state’s teaching workforce; and (3) estimate whether
edTPA scores predict the value-added estimates and
evaluation ratings of early-career teachers. This evidence
is crucial to the utility of edTPA: if edTPA scores do not
predict graduate outcomes, then state officials and TPPs
should examine whether and how they act on edTPA data.
In the remainder of this research brief, EPIC describes
the data and analyses, summarizes the edTPA scores for
candidates, and presents the predictive validity results.
Background
In these analyses EPIC focuses on officially-scored edTPA
portfolios from the 2013-14 through 2015-16 years. For
this study period three UNC System institutions had
officially-scored edTPA data: East Carolina University
(ECU) for their 2013-14, 2014-15, and 2015-16 graduating
cohorts and North Carolina State University (NCSU)
and the University of North Carolina Charlotte (UNCC)
for their 2014-15 and 2015-16 graduating cohorts. In
total, these performance assessment data cover 1,980
traditionally-prepared teacher candidates with complete
edTPA portfolios.
1
EPIC connected these edTPA scores
to administrative data from the NC Department of Public
Instruction (NCDPI) for the 2014-15 through 2016-17
school years. These NCDPI data include employment
records, teacher demographics, Education Value-Added
Assessment System (EVAAS) estimates, North Carolina
Educator Evaluation System (NCEES) ratings, classroom
roster files, and school characteristics.
From these NCDPI data EPIC created the outcome
measures for these analyses: (1) an indicator for whether
a teacher candidate worked as a teacher in a NC public
school in the year after TPP completion; (2) standardized
EVAAS estimates; and (3) a composite (standardized)
NCEES rating. The focal edTPA measures include
Planning, Instruction, and Assessment constructs identified
through factor analysis, a standardized total score, and
indicators for whether candidates met hypothetical passing
thresholds of 38, 40, and 42.
2
EPIC’s preferred analyses use
a university fixed effect to assess how variation in edTPA
scores, within a TPP, predicts variation in the outcomes for
that program’s graduates. All analyses control for candidate
demographics; the EVAAS and NCEES models also
control for student and school characteristics.
How are teacher candidates
scoring on edTPA?
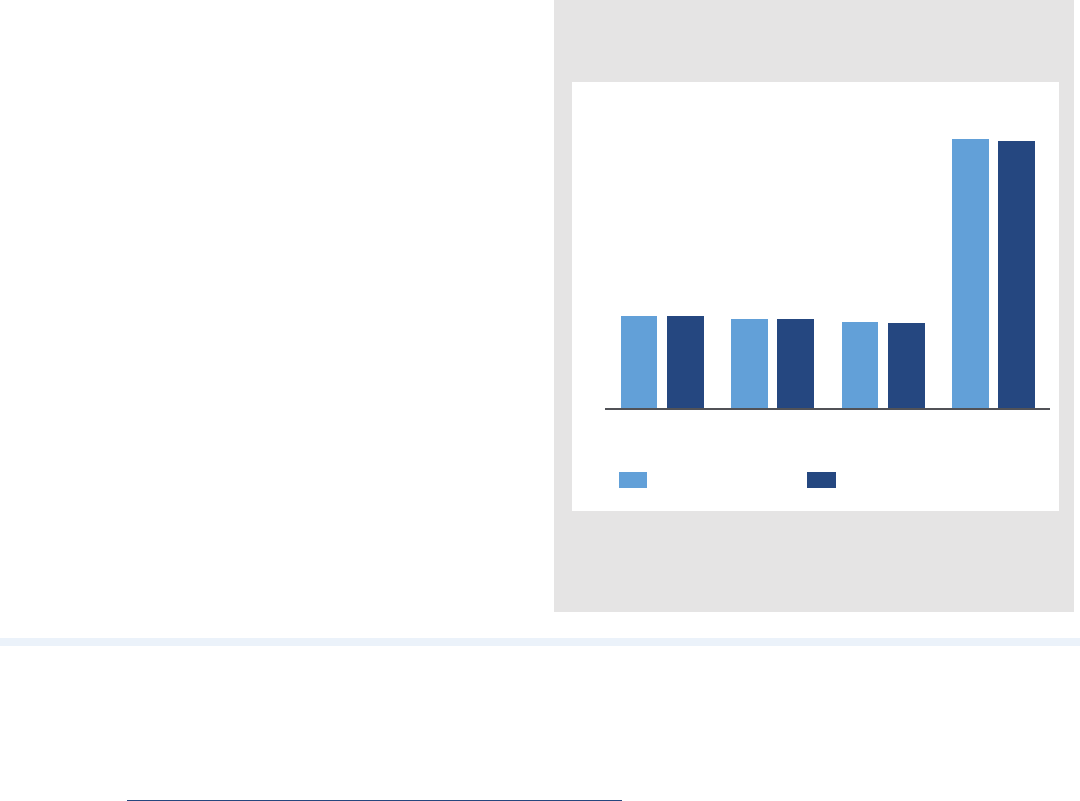
Figure 1 displays the average Planning, Instruction,
Assessment, and total score for UNC System candidates
in the study sample (n=1,980) and for teacher candidates,
nationwide, during the 2015 calendar year (approximately
n=27,000).
3
The average Planning, Instruction, and
Assessment scores for UNC System candidates are 15.25,
14.81, and 14.33, respectively. The average total score is
44.39. These values are all comparable to national averages
from 2015.
1
EPIC excluded teacher candidates who had condition codes (non-scored data) for any of the edTPA rubrics. Furthermore,
EPIC excluded lateral entry teachers who completed their edTPA portfolios while simultaneously serving as a classroom teacher.
2
In additional analyses EPIC examined whether each edTPA rubric predicted the effectiveness of early-career teachers.
EPIC shared these results with its partner institutions to drive their program improvement efforts.
3
Please see https://secure.aacte.org/apps/rl/res_get.php?fid=3013&ref=edtpa for the full 2015 edTPA report.
Figure 1: Average edTPA Scores for the UNC
System and Nationally
UNC Institutions National Average (2015)
50
15.25 15.30
14.81 14.70
14.33 14.20
44.39
44.20
40
30
20
10
0
Planning
Score
Instruction
Score
Assessment
Score
Total
Score
Note:ThisgurepresentsaverageedTPAscoresforUNCSystemcandidates
andforteachereducationcandidates,nationwide.Possiblescoresforthe
Planning,Instruction,andAssessmenttasksrangefrom5-25;possible
totalscoresrangefrom15to75
EDUCATION POLICY INITIATIVE at CAROLINA 3
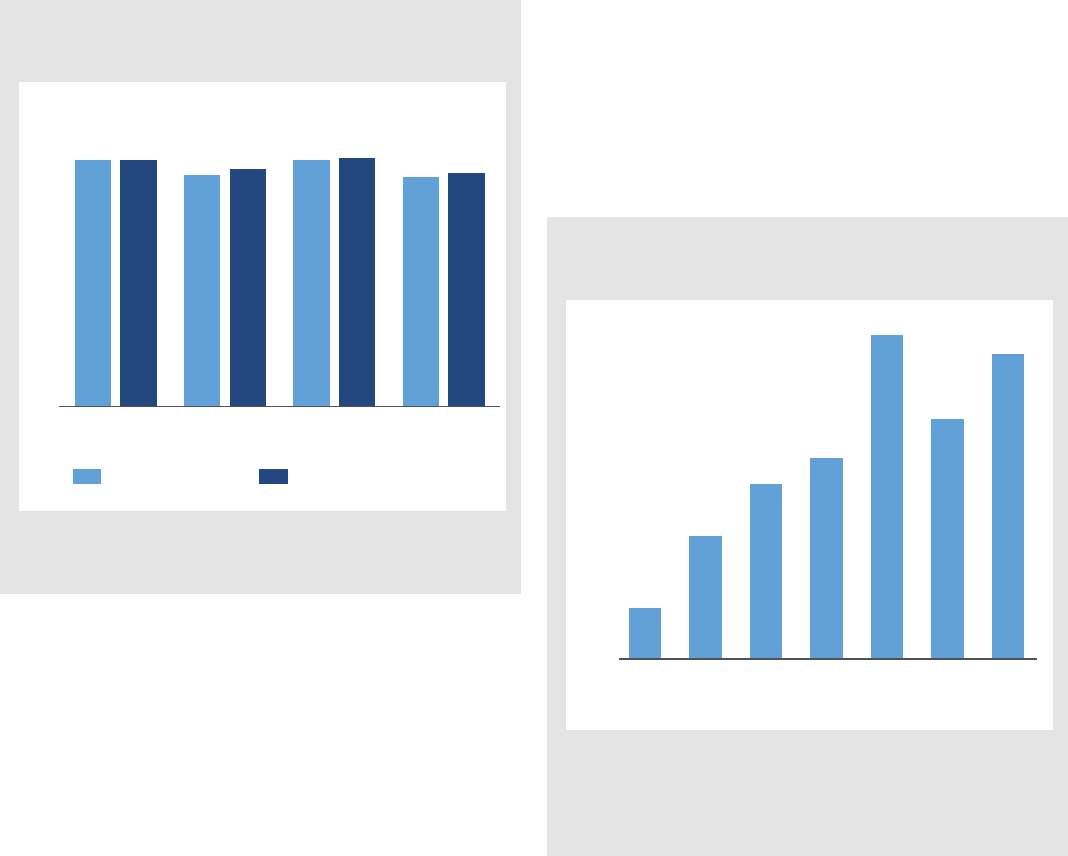
Figure 2 presents the average edTPA total score for white,
minority, female, and male teacher candidates from
UNC System institutions and for all teacher candidates
nationwide in 2015. Looking within the UNC System,
white candidates outscore their minority peers by
approximately 1.50 points while female candidates outscore
their male peers by nearly 1.70 points. Both of these
differences are statistically significant. These edTPA total
scores are comparable to national averages for the same
demographic subgroups.
Do edTPA scores predict
entry into North Carolina’s
teacher workforce?
Figure 3 displays results for whether edTPA scores predict
entry into the state’s public school teaching workforce
in the subsequent academic year. Regarding the edTPA
constructs, findings indicate that the Instruction and
Assessment factors predict the likelihood of securing a
teaching position. For example, a one standard deviation
increase in the Assessment factor score (equivalent to an
Assessment score that is three points higher) is associated
with a 2.7 percentage point increase in the probability of
teaching in North Carolina public schools in the following
year. Likewise, a one standard deviation increase in the
edTPA total score (equivalent to seven points) is associated
with a 3.1 percentage point increase in the probability of
teaching in North Carolina public schools. To put the
magnitude of these results into perspective, EPIC notes that
approximately 67 percent of the candidates in our sample
taught in NC public schools in the year after completing
their teacher preparation.
Do edTPA scores predict the
EVAAS estimates of early-career
teachers?
Table 1 presents the associations between the edTPA
scores of UNC system candidates and their EVAAS
estimates as first and second-year teachers. EVAAS follows
individual students over time and uses test scores from a
variety of state assessments to estimate the value-added
effectiveness of individual teachers. EPIC estimated
models for the predictive validity of edTPA across
all EVAAS data and separately for Text Reading and
Comprehension (TRC; early-grades reading),
EOG exams in elementary and middle grades, and
EOC and final exams in secondary grades.
Note:ThisgurepresentsaverageedTPAtotalscoresforwhite,minority,
female,andmaleteachereducationcandidatesintheUNCSystemand
forteachercandidatesnationwide.
Figure 2: Average edTPA Scores by Gender and
Minority Status (UNC System and Nationally)
UNC Institutions National Average (2015)
50
44.68 44.69
4 3.15
43.86
44.65
44.86
42.9 7
43.39
40
30
20
White
Candidates
Minority
Candidates
Female
Candidates
Male
Candidates
Figure 3: Do edTPA scores predict entry into
North Carolina’s public school teacher workforce?
Percentage Points More Likely to Enter NC Public Schools
Planning
Factor
Assessment
Factor
Total
Score
40 or
Above
Instruction
Factor
38 or
Above
42 or
Above
5
5.0+
4.7+
3.7
3.1*
2.7*
1.9+
0.8
3.8
2.5
1.3
0
Note:ThisgureshowswhetheredTPAscorespredicttheprobabilityofentering
theteachingforceinNorthCarolinaintheyearafterTPPcompletion.All
resultscomefrommodelswithauniversityxedeffectandareexpressed
inpercentagepointunits.‘+’and‘*’indicatestatisticalsignicanceatthe
0.10and0.05levels,respectively.

EDUCATION POLICY INITIATIVE at CAROLINA 4
For all EVAAS estimates, a one standard deviation
increase in the edTPA total score predicts a 6 percent
of a standard deviation increase in teacher value-added.
Candidates who met hypothetical passing thresholds also
had significantly higher EVAAS estimates. For instance,
candidates who scored at 42 or above had EVAAS
estimates nearly 15 percent of a standard deviation
higher than peers who scored below that threshold.
To put these results into perspective, EPIC notes that
the average difference in EVAAS estimates between first
and second-year teachers is approximately 14 percent of a
standard deviation. These predictive validity results
are strongest for early-grades reading—the mCLASS
TRC—and for EOC and final exams in secondary grades.
For those exams, a one standard deviation increase in the
edTPA total score predicts a 10-12 percent of a standard
deviation increase in EVAAS estimates.
Given anxiety that performance assessments may
complicate efforts to diversify the teacher workforce,
EPIC assessed how edTPA predictive validity results
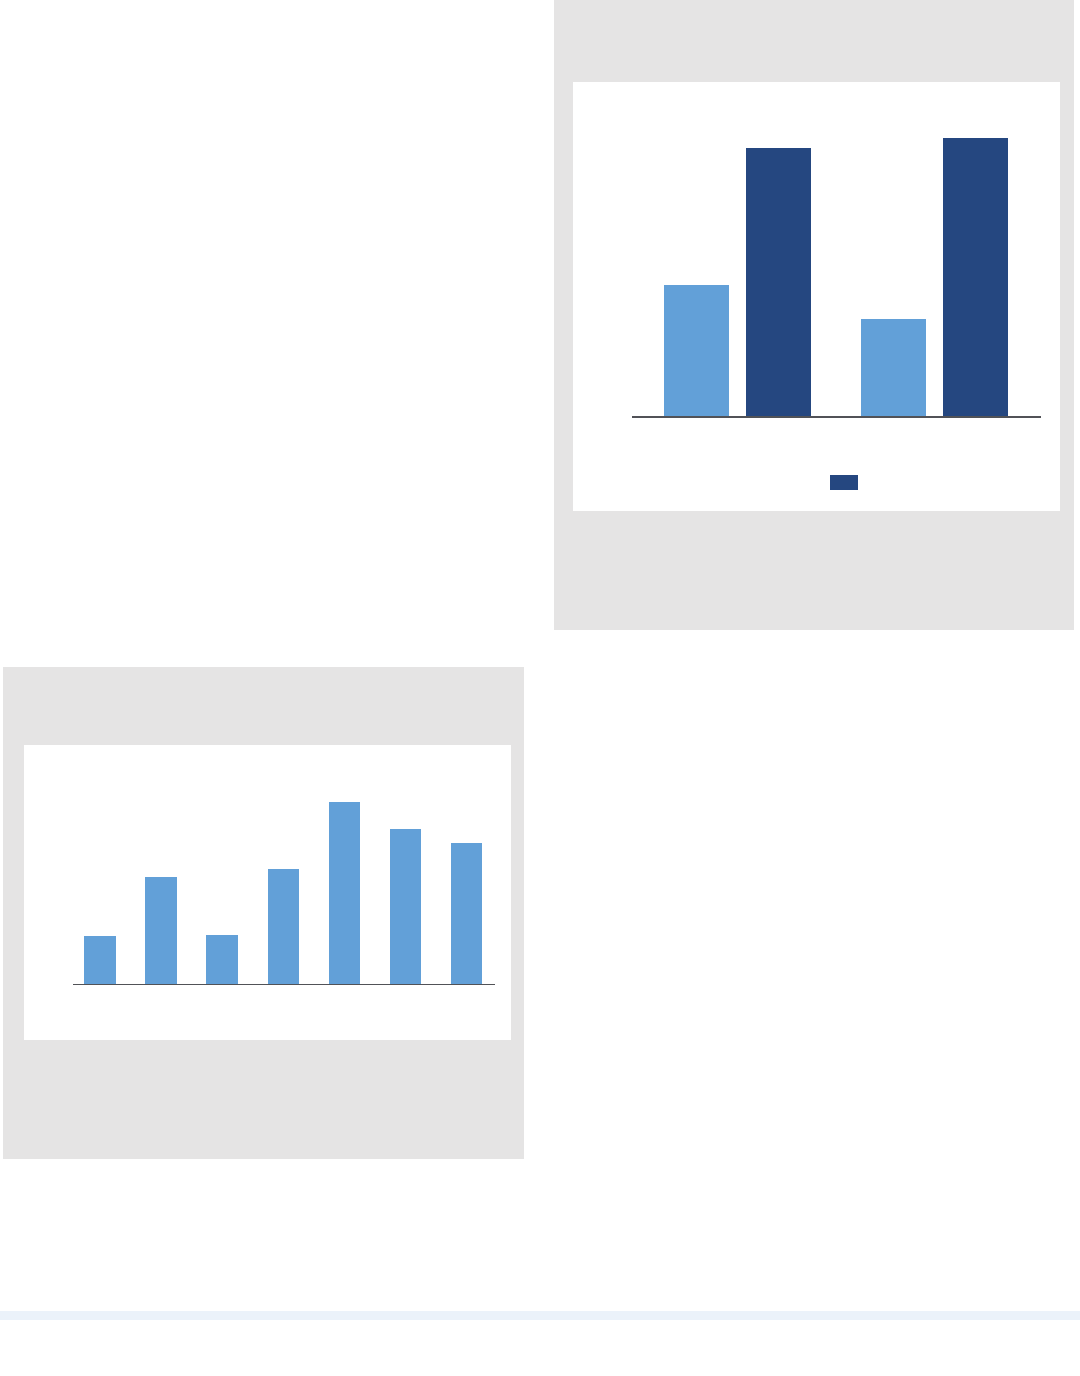
compare for white and minority candidates. Figure 4
presents results on the predictive validity of the edTPA
total score. Results for first-year teachers show that the
total score predicts significantly higher EVAAS estimates
for white and minority candidates. For example, a one
standard deviation increase in the total score of minority
candidates predicts a 12 percent of a standard deviation
Note:ThistablepresentsassociationsbetweentheedTPAscoresofUNCSystemcandidatesandtheirEVAASestimates(standardized)asrstandsecond-year
teachers.Allresultscomefrommodelswithauniversityxedeffect.‘+’and‘*’indicatestatisticalsignicanceatthe0.10and0.05levels,respectively.
All EVAAS Estimates
Text Reading and
Comprehension
EOG Exams
EOC and Final Exams
in Secondary Grades
Planning Factor
0.033
0.057 0.012 0.040
Instruction Factor
0.028
0.033 0.020 0.097*
Assessment Factor
0.036
0.095+ 0.046 0.048
Total Score
0.057*
0.118* 0.046 0.103+
Total Score: 38 or Above
0.135*
0.260* 0.127 0.229+
Total Score: 40 or Above
0.113+
0.256* 0.121 0.145
Total Score: 42 or Above
0.148*
0.185 0.136+ 0.335*
Observations
2313
659 1102 552
Table 1: Do edTPA scores predict the EVAAS estimates of early-career teachers?
Note:ThisgurepresentsassociationsbetweentheedTPAtotalscoresof
whiteandminorityUNCSystemgraduatesandtheirEVAASestimates
(standardized)asearly-careerteachers.Allresultscomefrommodelswith
auniversityxedeffect.‘+’and‘*’indicatestatisticalsignicanceatthe
0.10and0.05levels,respectively.
Figure 4: The predictive validity of edTPA scores for
white and minority teachers (EVAAS)
0.060+
0.064*
0.045
0.117+
0.12
0.09
0.06
0.0 3
0
White Teachers Minority Teachers
First-Year
Teachers
First and
Second-Year Teachers
increase in their EVAAS estimates. For first and second-
year teachers, combined, only the total score of white
candidates predicts significantly higher value-added.
EDUCATION POLICY INITIATIVE at CAROLINA 5
Do edTPA scores predict the
NCEES ratings of early-career
teachers?
Figure 5 presents the associations between the edTPA
scores of UNC System candidates and their ratings as
first and second year teachers on a composite NCEES
measure (standardized).
4
NCEES is an evaluation rubric
based on the Framework for 21st Century Learning and
the North Carolina Professional Teaching Standards.
Regarding the edTPA constructs, results indicate that all
three factors predict higher evaluation ratings. The results
for Planning and Assessment are significant but modest;
the estimate for Instruction is larger and indicates that a
one standard deviation increase in the Instruction factor
predicts a 6 percent of a standard deviation increase in the
composite evaluation measure. The edTPA total score is
also associated with a 6 to 7 percent of a standard deviation
increase in the composite rating. To put these results into
perspective, EPIC notes that the average difference in
evaluation ratings between first and second-year teachers is
approximately 35 percent of a standard deviation. Finally,
whether candidates meet hypothetical passing thresholds
Note:ThisgurepresentsassociationsbetweentheedTPAscoresofUNC
SystemcandidatesandtheirNCEEScompositerating(standardized)
asrstandsecond-yearteachers.Allresultscomefrommodelswitha
universityxedeffect.‘+’and‘*’indicatestatisticalsignicanceatthe
0.10and0.05levels,respectively.
Figure 5: Do edTPA scores predict the NCEES
ratings of early-career teachers?
Planning
Factor
Assessment
Factor
Total
Score
40 or
Above
Instruction
Factor
38 or
Above
42 or
Above
0.10 6 *
0.083*
0.091*
0.067*
0.029+
0.063*
0.028+
0.12
0.0 9
0.06
0.03
0
is also related to their composite evaluation rating. For
example, candidates scoring at 38 or above have composite
evaluation ratings that are 10 percent of a standard
deviation higher than their peers scoring below a 38.
Figure 6 displays NCEES predictive validity findings
for white and minority candidates. Results for first-
year teachers show that the edTPA total score predicts
significantly higher NCEES ratings for white and
minority candidates. A one standard deviation increase
in the total score of minority candidates predicts a
14 percent of a standard deviation increase in their NCEES
composite rating; the result is significant but half that for
white candidates. The predictive validity estimates for
first and second-year teachers are comparable to those for
first-year teachers. These results indicate that minority
candidates’ edTPA performance is related to their future
teaching evaluations.
4
EPIC created this composite evaluation rating by summing teachers’ ratings on standards 1-5 of the NCEES and standardizing this
value. Predictive validity results are similar for individual NCEES standards.
Note:ThisgurepresentsassociationsbetweentheedTPAtotalscoresof
whiteandminorityUNCSystemgraduatesandtheirNCEEScomposite
estimates(standardized)asearly-careerteachers.Allresultscome
frommodelswithauniversityxedeffect.‘+’and‘*’indicatestatistical
signicanceatthe0.10and0.05levels,respectively.
Figure 6: The predictive validity of edTPA scores for
white and minority teachers (NCEES)
0.070*
0.052*
0.14 6 *
0.141 *
White Teachers Minority Teachers
First-Year
Teachers
First and
Second-Year Teachers
0.16
0.12
0.08
0.04
0

Study Author: Kevin C. Bastian (June 2018)
EPIC is an interdisciplinary team that conducts rigorous research and evaluation to inform education
policy and practice. We produce evidence to guide data-driven decision-making using qualitative
and quantitative methodologies tailored to the target audience. By serving multiple stakeholders,
including policy-makers, administrators in districts and institutions of higher education, and program
implementers we strengthen the growing body of research on what works and in which context.
Our work is ultimately driven by a vision of high quality and equitable education experiences for all
students, and particularly students in North Carolina.
http://publicpolicy.unc.edu/epic-home/
For more research on this topic
Bastian, K.C., Henry, G.T., Yi, P., & Lys, D. (2016). Teacher candidate performance assessments: Local scoring and
implications for teacher preparation program improvement. Teaching and Teacher Education, 59, 1-12.
Bastian, K.C. Lys, D., & Yi, P. (2018). A framework for improvement: Analyzing performance assessment scores for
evidence-based teacher preparation program reforms. In press, Journal of Teacher Education.
Goldhaber, D., Cowan, J., & Theobald, R. (2017). Evaluating prospective teachers: Testing the predictive validity of
edTPA. Journal of Teacher Education, 68(4), 377-393.
Ledwell, K. & Oyler, C. (2016). Unstandardized responses to a “standardized” test: The edTPA as gatekeeper and
curriculum change agent. Journal of Teacher Education, 67(2), 120-134.
Peck, C.A., Singer-Gabella, M., Sloan, T., & Lin, S. (2014). Driving blind: Why we need standardized performance
assessment in teacher education. Journal of Curriculum and Instruction, 8(1), 8-30.
Discussion
As a data point that will soon be common to many teacher
candidates across North Carolina, edTPA has the potential
to help state officials and TPPs leverage evidence-based
accountability and growth. However, this potential is
contingent upon edTPA predicting program and candidate
outcomes. This study represents an early effort to assess
these relationships; continued work is necessary as the
scope of edTPA implementation expands.
Overall, EPIC finds that the edTPA scores of UNC
System candidates are comparable to national averages.
Like national data, there is also a need to improve the
edTPA performance of minority and male candidates
in North Carolina. When connecting edTPA scores
to NCDPI administrative data, EPIC finds that higher
scoring candidates are more likely to secure teaching
positions in the state’s public schools. Furthermore, results
generally show a positive and significant relationship
between edTPA scores and the performance of early-career
teachers. For EVAAS, these positive results are strongest
for the mCLASS TRC and for EOC and final exams in
secondary grades. For EVAAS and NCEES, predictive
validity exists for white and minority candidates. Further
analyses (not displayed) show that the predictive validity of
edTPA is strongest at institutions where edTPA scores are
consequential for licensure. As such, future research should
continue to assess predictive validity as edTPA becomes
consequential across North Carolina.
