
FASHION ON
CLIMATE
HOW THE FASHION INDUSTRY CAN URGENTLY ACT
TO REDUCE ITS GREENHOUSE GAS EMISSIONS
IMPRINT
This report is authored by McKinsey & Company (McKinsey)
in partnership with Global Fashion Agenda (GFA). Through
a multi-year strategic knowledge partnership, Global
Fashion Agenda and McKinsey aim to present research and
a fact base on the priorities of the CEO Agenda and to
guide and mobilise fashion executives in taking bold
action on sustainability.
PUBLISHED BY
AUTHORS: Achim Berg and Karl-Hendrik Magnus are Senior
Partners and leaders of McKinsey & Company’s Global
Apparel, Fashion & Luxury practice Sara Kappelmark is a
partner in the Apparel, Fashion & Luxury practice. Anna
Granskog is a Partner, Libbi Lee and Corinne Sawers are
Associate Partners and Poorni Polgampola an Engagement
Manager in McKinsey & Company’s Global Sustainability
Practice.
Morten Lehmann is Chief Sustainability Officer at Global
Fashion Agenda, where Holly Syrett is Senior Sustainability
Manager and Gizem Arici is Sustainability Manager.
COPYWRITER: David Wigan
ART DIRECTOR: Thomas Blankschøn
GRAPHIC DESIGN: Daniel Siim
© 2020 copyright McKinsey & Company
and Global Fashion Agenda

IMPRINT
All rights reserved. Reproduction is strictly prohibited without prior written permission from the authors. Every
effort has been made to trace the copyright holders for this publication. Should any copyright holders have been
inadvertently overlooked, McKinsey & Company and Global Fashion Agenda will make the necessary changes.
ABOUT GLOBAL FASHION AGENDA
Global Fashion Agenda is the foremost thought leadership
and advocacy forum for industry collaboration and
public-private cooperation on sustainability in fashion.
The non-profit organisation is on a mission to mobilise
and guide the fashion industry to take bold and urgent
action on sustainability. Global Fashion Agenda is
behind yearly guidelines, reports such as the CEO
Agenda and the leading business event on sustainability
in fashion, Copenhagen Fashion Summit, which has been
spearheading the movement for over a decade.
ABOUT MCKINSEY & COMPANY
McKinsey & Company is a global management consulting
firm deeply committed to helping institutions in the
private, public and social sectors achieve lasting
success. McKinsey supports clients in fashion and beyond
on a wide range of sustainability related themes with
a strong impact orientation. This ranges from executing
broader sustainability transformation programmes to more
targeted efforts on decarbonisation, circular business
models and sustainable packaging. McKinsey & Company is
a Strategic Knowledge Partner to GFA, with the joint
aim to accelerate the pace and impact of the fashion
industry’s transformation towards sustainability.
ACKNOWLEDGEMENTS
The authors would like to thank all of those who
contributed to this publication. Special thanks go to
Global Fashion Agenda’s Strategic and Associate Partners,
as well as the industry experts and the broader fashion
community who have contributed their time, insight and
expertise to this report. We would also like to thank
David Schmelzeisen and Amrei Becker from the Institut für
Textiltechnik, RWTH Aachen University.
We extend our thanks to several McKinsey & Company
colleagues for their contributions to this report:
Victoria Benbassat, Anja Bühner-Blaschke, Adriana
Clemens, Michel Foucaurt, Eric Hannon, Kimberly
Henderson, Saskia Hedrich, Kristen Jennings, Nimalan
M, Mihael Maljak, Tomas Nauclér, Althea Peng, Mohammed
Rahamatulla, Cristina Schaub, Ewa Sikora, Marie
Strawczynski, Heidi Van Dyck, Jan Vlcek, Daan Walter,
Jop Weterings, Annikka Wong, Waris Ziarkash.
At Global Fashion Agenda, we extend our thanks
for their contributions, to: Eva Kruse, Thomas
Tochtermann, Kerry Huang, Marie Louise Wedel Bruun,
Molly Polk Hannon, Cleshawn Montague, Maria Luisa
Martinez and Beatrice Perlman Ewert.


01 — 52
PREFACE
When COVID-19 erupted this year, it highlighted
the interconnectedness of our lives and the
inherent uncertainty surrounding global economies,
businesses and humankind. Similarly, the protests
associated with the Black Lives Matter movement
have increased the pressure to solve social
issues that pervade large parts of society and
the fashion industry. This turbulent year has
heightened awareness of the many challenges the
fashion industry is facing, including in supplier
relationships, greenhouse gas (GHG) emissions,
employment structures, overproduction and wastage.
These systemic issues are also apparent in the
looming threat of climate change, which is set to
create accelerating socioeconomic impacts over
the coming years. If we fail to take coordinated
action on the greenhouse gas (GHG) emissions
causing climate change, we can expect to see
increasingly common crises such as heatwaves,
rising sea levels and damage to ecosystems that
are vital to our future.
This year marks a milestone in the industry’s
journey to restrict global warming to the 1.5
degress targeted by the Paris Climate Change
Agreement.
1
To date, only around 50 fashion
companies have committed to the science-based
targets aligned with the agreement.
2
,
3
As a significant contributor to climate change,
the fashion industry needs to act now to cut
its GHG emissions.
4
The onus is on fashion
leaders to move from a moderate decarbonisation
trajectory to a significantly more ambitious one.
With that challenge in mind, it has never been
more important to explore the emissions status
quo and to understand in detail how various
decarbonisation scenarios may play out.
This report presents an analysis on the fashion
industry’s GHG emissions and outlines areas
in which players can focus their efforts to
meet climate targets. By triangulating GHG
emissions data, analysing current and accelerated
trajectories, and quantifying the gap to meeting
the Paris targets, it offers insight into the
industry’s potential for decarbonisation and
presents recommendations for moving forward.
The report addresses stakeholders that include
brands, retailers, manufacturers, citizens,
investors, and policy makers to play their part
in putting the fashion industry on the 1.5-degree
pathway. Only by daring to change, collaborate and
embrace new ways of operating can we, together,
transform the industry and create prosperity for
people and communities while working within planetary
boundaries, protecting biodiversity and minimising
the industry’s contribution to global warming.

02 — 52
“TWO THIRDS OF CONSUMERS
SAY IT HAS BECOME EVEN MORE
IMPORTANT TO LIMIT CLIMATE
CHANGE FOLLOWING COVID-19.”
5
RISING EXPECTATIONS ON SUSTAINABILITY
COVID-19 is having a significant effect on the fashion industry, disrupting value chains, closing many
of the world’s retail outlets and creating a new level of public awareness over health, safety and the
fragility of the planet. It has forced brands and upstream players to take difficult decisions every day,
from managing cash flows, to rethinking distribution models and acting to protect the health of employees
and consumers alike.
At the same time, consumers are becoming increasingly engaged with sustainability topics, including social
issues and climate change, as evidenced by movements such as Friday’s for Future.
6
Many are showing their
willingness to rethink how, when and what they buy.
7
Sustainability issues are also attracting increasing attention at executive level. Some 50% of fashion
executives in a recent opinion poll indicated that sustainability has moved up the agenda in recent months.
8
A rising number of asset and wealth managers have mandates that prioritise companies that pass sustainability
thresholds.
9
Moreover, COVID-19 has spurred policy makers to refocus on sustainability, with various regional
and national authorities tying post-COVID recovery efforts to sustainability objectives.
10, 11

03 — 52
EXECUTIVE SUMMARY
Since the Industrial Revolution, GHG emissions have
contributed to atmospheric warming that has lifted
global temperatures by around 1.1 degrees, with
significant regional variations.
12
,
13
The warming
has precipitated more frequent and severe risks,
including flooding, fires, droughts and storms,
leading to socioeconomic impacts on, e.g. liveability
and workability, food systems and natural capital.
With temperatures set to continue their upward
trajectory, it is likely these adverse impacts will
become more severe over the coming years.
14
This research shows that the global fashion industry
produced around 2.1 billion tonnes of GHG emissions
in 2018, equalling 4% of the global total.
15
This
is equivalent to the combined annual GHG emissions
of France, Germany and the United Kingdom.
16
Around
70% of the fashion industry’s emissions came from
upstream activities such as materials production,
preparation and processing. The remaining 30% were
associated with downstream retail operations, the
use-phase and end-of-use activities.
17
Adding to the challenge of reducing its GHG footprint
is the expectation that the fashion industry will
continue to grow as a result of shifting population
and consumption patterns. If no further action is
taken over the next decade beyond measures already
in place, the industry’s GHG emissions will likely
rise to around 2.7 billion tonnes a year by 2030,
reflecting an annual volume growth rate of 2.7%.
18

04 — 52
This research analyses two scenarios for the industry’s abatement efforts:
1. Current pace trajectory.
19
If the industry continues to embrace current decarbonisation
initiatives at the current pace, emissions will be capped at around 2.1 billion tonnes a
year by 2030, around the same as they are now. This would leave levels at nearly double
the maximum required to stay on the 1.5-degree pathway.
20
2. Accelerated abatement.
21
To align with the 1.5-degree pathway over the next 10 years,
the fashion industry should intensify its efforts. In practice, that means embracing
accelerated abatement, which is estimated to reduce annual emissions to around 1.1 billion
tonnes, around half of today’s figure.
22
The immediate focus of accelerated abatement
should be upstream operations, where around 60% of emissions savings are possible, in
particular from increased use of renewable energy, through collaborative efforts supported
by brands and retailers. Actions relating to brands’ own operations have the potential to
deliver around 20% of the reduction, with the remainder coming from changes in consumer
behaviour. By 2030, these efforts will need to have created a significantly reformed
fashion landscape, in which, for example, one out of five garmentsare traded through a
circular business model.
The good news for the fashion industry is that many of the required actions can be delivered at
a moderate cost. Around 90% of the accelerated abatement can be delivered below a cost of around
USD50 per tonne of GHG emissions.
23
Around 55% of the actions required will lead to net cost
savings on an industrywide basis. The remaining actions will require incentivisation in the form
of consumer demand or regulations to deliver abatement. Additionally, around 60% of the abatement
will require upfront capital, where brands and retailers will need to support and collaborate with
value chain players to invest for the long-term benefit of society and the environment.
24
The scale of change required implies a need for bold commitments. Stakeholders throughout the
value chain should be willing to make bold commitments, followed by equally bold actions,
transparency, collaboration and joint investment. Brands and suppliers need to step up engagement
with policy makers, support the roll out of renewable energy and drive end-of-use collections for
recycling.
25
Beyond 2030, the challenge becomes even greater. To stay on the 1.5-degree pathway, the industry
needs to go beyond this vision of accelerated abatement to fundamentally redefine business models
and current imperatives of economic growth and rising consumerism. For a prosperous future and an
habitable earth, the industry’s ingenuity and creative spirit will be required to decouple value
creation from volume growth and to move from commitments to actions.
EXECUTIVE SUMMARY

Material
Production
38%
Yarn
Preparation
8%
Product Use
2O%
Retail
3%
Transport
3%
Fabric
Preparation
6%
Cut
Make
Trim
4%
Wet
Processes
15%
2,1O6 Mn
tonnes CO2eq
1OO%
APPAREL AND FOOTWEAR
VALUE CHAIN GHG EMISSIONS
IN 2018
Upstream Production
Brand Operations
Usage & End-of-use
End-of-use
3%
05 — 52
BASELINING THE FASHION INDUSTRY’S GHG EMISSIONS
THE STATUS QUO ON INDUSTRY
EMISSIONS AND ABATEMENT EFFORTS
The fashion industry accounts for around 4% of
emissions globally, equivalent to the combined
annual GHG emissions of France, Germany and
the United Kingdom.
26,
27
More than 70% of
the emissions come from upstream activities,
particularly energy-intensive raw material
production, preparation and processing.
28
The remaining 30% are generated by downstream
activities such as transport, packaging, retail
operations, usage and end-of-use.
29
“THE FASHION INDUSTRY
ACCOUNTS FOR AROUND
4% OF GLOBAL GHG
EMISSIONS”

06 — 52
BASELINE CALCULATION METHODOLOGY
To determine the industry’s baseline emissions, we leveraged a bottom-up analysis
using proprietary data. The calculation took into account the entire fashion
industry’s value chain, including downstream usage and end-of-use stages. However,
it did not include secondary activities such as fashion shows or the back-office
emissions of individual companies.
The calculations considered the volume of garments produced, used and disposed
of in a given year to develop an annualised emissions baseline, rather than a
lifecycle analysis. The analysis is based on the annual volume of fibres used
to meet garment demand for the year 2018 and data on emissions intensity of raw
materials from various sources.
30
We analysed the energy consumption and emissions
intensity of key value chain stages across production and consumption countries,
31
using third-party data, as well as proprietary energy mix and emissions data from
McKinsey’s “Global Energy Perspective” and “Energy Insights” reports.
The baseline calculation was triangulated using a top-down analysis of reports on the
industry’s emissions. The triangulation exercise indicated emissions ranging from 3%
to 10% of global emissions. The disparity was largely driven by the sensitivity of
the baseline emissions calculation to energy consumption and energy mix assumptions,
as well as the scope of value chain stages included in the analysis.

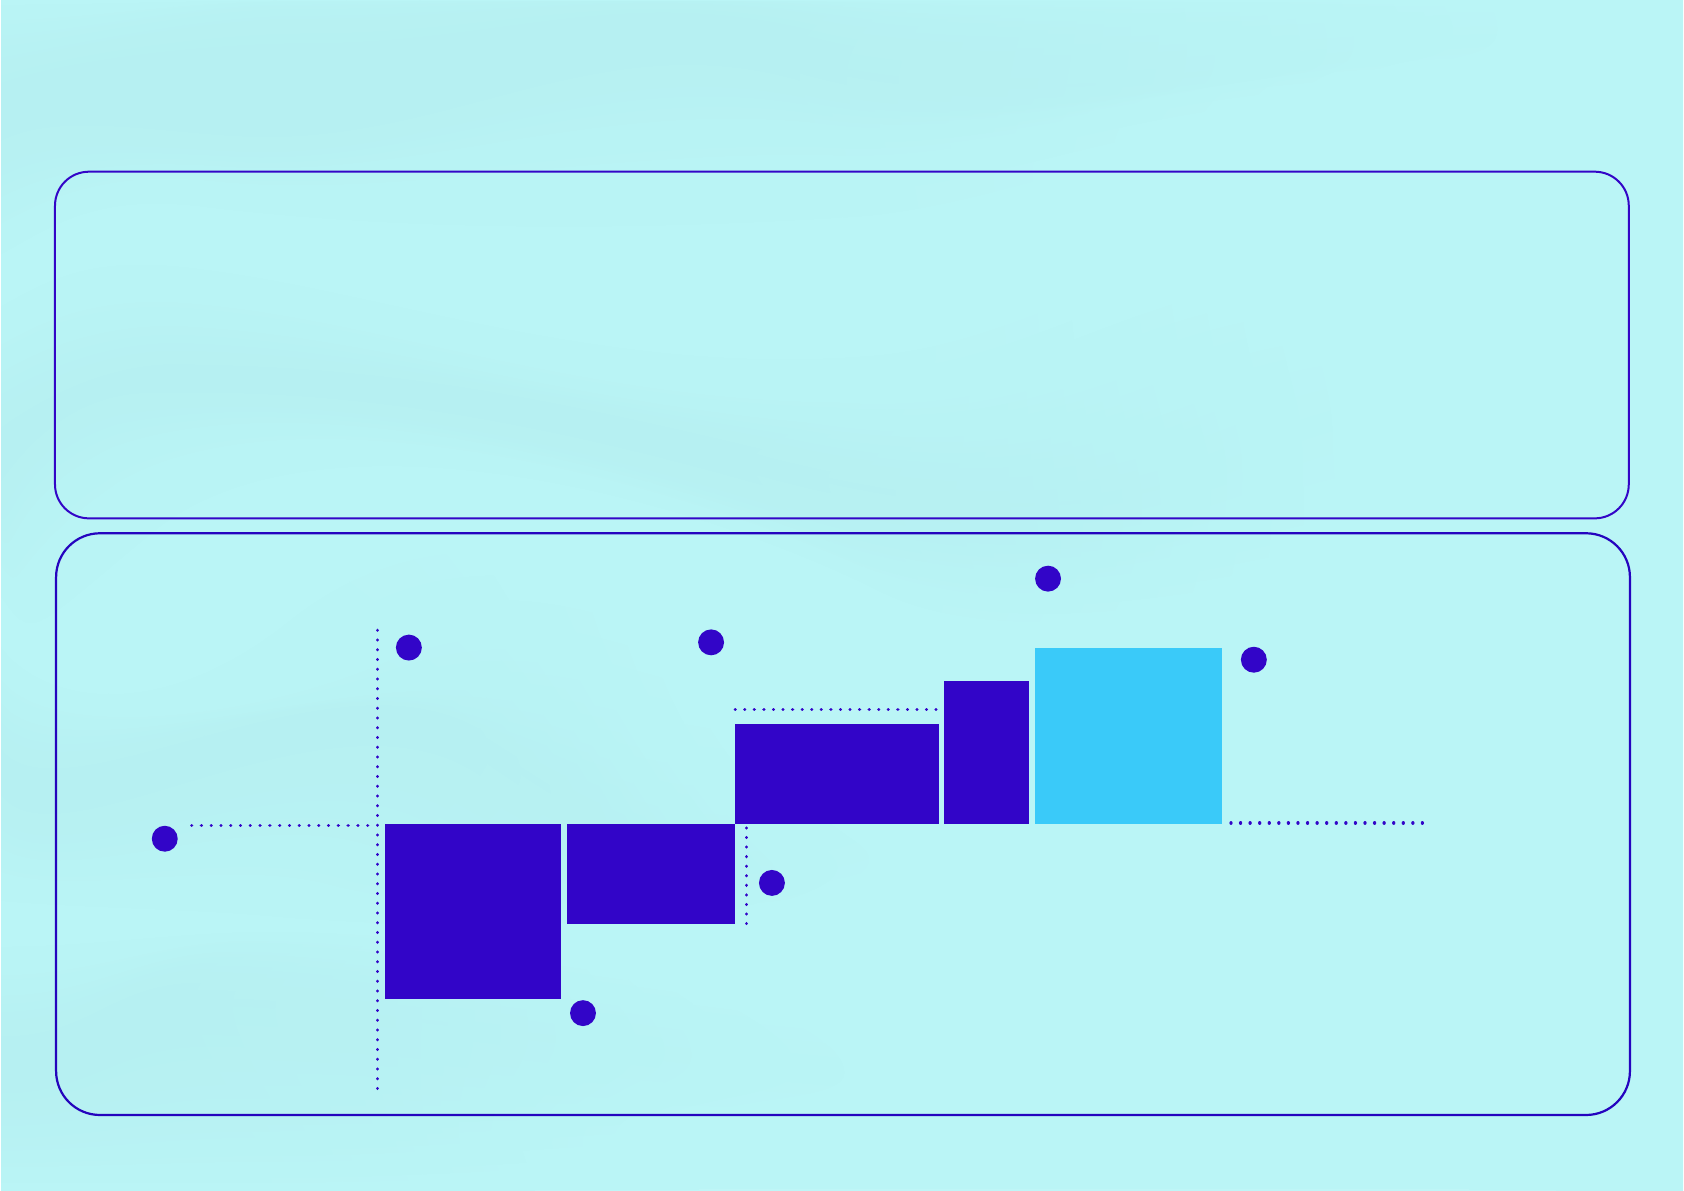
2O18 2O3O 2O3O
Emissions Emissions
under no
further
action
Emissions
under
current
pace
Gap to
1.5-degree
pathway
2,74O
Mn tonnes
CO2Eq
1,OOO
1,1OO
O
2,OOO
3,OOO
2,1O6 2,1O4
~5O%
1.5-degree
pathway
EMISSIONS ABATEMENT ASSUMING NO FURTHER
ACTION OR INDUSTRY DECARBONISATION
CONTINUES AT CURRENT PACE
07 — 52
With no further abatement action beyond that
already taking place, emissions will rise by
around a third to some 2.7 billion tonnes in
2030,
assuming a relatively speedy post-COVID-19
economic rebound and continued growth thereafter
(in line with industry forecasts).
32
33
Current pace. If abatement efforts continue to
expand at the current rate, the industry can
maintain GHG emissions at 2.1 billion tonnes in
2030. In net terms, this represents an abatement
potential of around 636 million tonnes.
Around 43% of that potential is associated with
decarbonised production and process efficiency
improvements, including initiatives across
spinning, weaving and knitting; shifting away from
wet towards dry processing; transitioning from
coal to electric energy; and increasing use of
renewable energy across the value chain.
34
Other
elements include reduction of overproduction and
manufacturing process wastage, greater use of
circular business models, and consumer-led changes
such as reduced washing and drying. If emissions
reductions continue on the current trajectory,
these can offset the additional emissions that
will be created by the industry’s growth up to
2030. However, these will not be sufficient to put
the industry on a 1.5-degree pathway.
To track a path to 1.5 degrees, the industry
will be required to accelerate its efforts over
the coming decade, reducing emissions by half to
around 1.1 billion tonnes by 2030.
35
This will
require the industry to accelerate abatement
actions, including scaling up and intensifying
current decarbonisation approaches.
36
BASELINING THE FASHION INDUSTRY’S GHG EMISSIONS
“UNDER ITS CURRENT TRAJECTORY,
THE FASHION INDUSTRY WILL MISS
THE 1.5-DEGREE PATHWAY
BY 50%.”

08 — 52
THE INDUSTRY’S ACCELERATED ABATEMENT POTENTIAL
“OVER THE NEXT DECADE,
THE INDUSTRY CAN CUT ITS
COLLECTIVE GHG FOOTPRINT IN
HALF FROM CURRENT LEVELS.”
ACCELERATED ABATEMENT TO PUT
THE INDUSTRY ON THE 1.5-DEGREE
PATHWAY
Accelerated abatement. Under an accelerated
abatement scenario, the industry can reduce
emissions to around 1.1 billion tonnes in 2030,
putting it on the 1.5-degree pathway. We define
accelerated abatement as the effort required to
move the industry from 2.7 billion tonnes of
emissions under the no-further-action baseline to
1.1 billion tonnes in 2030.
37
Accelerated abatement is achievable through many
of the same levers that are currently being used
to cut emissions, but on an expanded scale or
with a higher level of adoption.
38
The primary
drivers of accelerated abatement will be brands
and retailers, which can affect change in their
own operations, support value chain participants
in their decarbonisation efforts and create
opportunities for consumers to make sustainable
consumption choices. It will require concerted
and committed action in three areas:
• Reducing emissions from upstream operations
• Reducing emissions from brands’ own operations
• Encouraging sustainable consumer behaviours
2O18 2O3O 2O3O
Emissions Emissions
under no
further
action
Emissions
under
current
pace
2,74O
2,1O6 2,1O4
2O3O
Emissions
under
accelerated
abatement
1,O64
Mn tonnes
CO2Eq
O
1,1OO
1,OOO
2,OOO
3,OOO
1.5-degree
pathway
EMISSIONS ABATEMENT ASSUMING
ACCELERATED INDUSTRY
DECARBONISATION

09 — 52
THE INDUSTRY’S ACCELERATED ABATEMENT POTENTIAL
“60% OF THE
ACCELERATED ABATEMENT
POTENTIAL LIES
IN DECARBONISING
UPSTREAM OPERATIONS,
20% LIES IN BRANDS’
OWN OPERATIONS,
AND 20% RELIES
ON ENCOURAGING
SUSTAINABLE CONSUMER
BEHAVIOURS”
18%
1,676 Mn
tonnes CO2eq
1OO%
61%
21%
Encouraging sustainable consumer behaviours
Reducing emissions from brands' own operations
Reducing emissions from upstream operations
KEY SOURCES OF EMISSIONS SAVINGS
UNDER ACCELERATED ABATEMENT

-2O5
-7O3
-24
-9O
1‚653
Decarbonised
material
production
Decarbonised
material
processing
Minimised
production
& manufacturing
wastage
Decarbonised
garment
production
1‚676
655
61%
Total
accelerated
abatement
potential
EMISSIONS SAVINGS WITHIN UPSTREAM PRODUCTION UNDER ACCELERATED ABATEMENT
Mn tonnes
CO2Eq
Upstream Production
Brand Operations
Usage & End-of-use
18%
21%
10 — 52
REDUCING EMISSIONS FROM UPSTREAM OPERATIONS
Decarbonised material processing
could deliver 703 million tonnes
of GHG emissions savings through
renewable energy and efficiency
improvements. This assumes a 5%
efficiency gain in spinning,
weaving and knitting stages,
for example through motor and
air pressure modifications in
machinery. It assumes a shift from
wet to dry processing and adoption
of processing technologies that
consume less energy.
40
,
41
Additionally, the analysis assumes
the use of 100% renewable energy
in processing stages, supported by
brands and retailers.
42
THE DECARBONISATION OF UPSTREAM VALUE
CHAIN ACTIVITIES HAS THE POTENTIAL TO
DRIVE 61% OF THE AMBITIOUS 1.7 BILLION
TONNES OF ACCELERATED ABATEMENT POTENTIAL
IN 2030.
Minimised production and manufacturing
wastage could deliver 24 million
tonnes of GHG emissions savings.
This assumes a 1-2 percentage point
improvement in the waste generated
in the transition from fibre to
textiles and in cutting waste in
the garment manufacturing stage
through better design and modern
cutting techniques.
43
Decarbonised garment manufacturing
could deliver 90 million tonnes of
GHG emissions savings. This assumes
a 30% energy efficiency improvement
across heating, ventilation and
air conditioning-related equipment
and an around 20% efficiency
improvement in sewing machines
through new technologies and
equipment upgrades.
44
Additionally, the analysis assumes
the use of 100% renewable energy in
the garment manufacturing stage,
supported by brands and retailers.
45
Decarbonised material production
could reduce annual GHG emissions
by 205 million tonnes. This assumes
around 20% of energy efficiency
improvements for polyester
production, based on technology
improvements within machinery,
and an around 40% reduction in
fertiliser and pesticide usage in
cotton cultivation, due to improved
farming practices such as targeted
spreading.
39
Fertilisers are a
significant source of nitrogen-
linked GHG emissions, while
pesticides emit carbon during
manufacturing. They account for
around 70% of GHG emissions in
conventional cotton cultivation.

11 — 52
ENABLE ENERGY EFFICIENCY IMPROVEMENTS
AND ENERGY TRANSITIONS
Under an accelerated abatement scenario, energy
efficiency and energy transition levers can deliver
around 1 billion tonnes of GHG emissions abatement
in 2030 across the value chain. Around 45% of savings
can be derived from efficiency improvements in raw
material production, preparation and processing,
while 39% will be associated with the transition
to renewable energy. The remaining 16% could be
delivered by switching from coal energy boilers to
electric boilers for synthetic material production.
Brands and retailers play a key role in supporting
the energy transition of upstream operations.
One promising avenue is through power purchase
agreements (PPA) in supplier countries. These
are long-term contracts to purchase energy during
the contract period. To make the investment case
viable and to secure financing for a new renewable
power asset and long-term (10-20 years) offtake
agreement, brands can offer their probable higher
credit rating to secure more favourable terms. Power
purchase agreements are currently not available in
Bangladesh and Turkey, but they are seeing rising
use in other major supplier countries, including
China, India and Vietnam.
Another option for brands is to support the purchase
of unbundled Energy Attribute Certificates.
These instruments verify that 1 MWh of renewable
electricity was generated by a sustainable power
source and fed back into the grid. While value chain
players are able to purchase these certificates,
brands can offer support by incentivising or
rewarding purchases. Widely available in China,
India and Turkey, they are starting to appear in
Bangladesh, Indonesia and Vietnam.
Overall, the longer-term picture on renewable
energy is encouraging. Corporate groups such as
the RE100 are driving the agenda to grow renewable
energy sourcing and brand-supported action could
significantly contribute to accelerating the energy
transition in supplier geographies.
46
“SOME 63% OF
ACCELERATED ABATEMENT
POTENTIAL LIES IN ENERGY
EFFICIENCY AND THE
TRANSITION TO CLEANER
ENERGY SOURCES.”
Emissions abatement due to energy related levers
Emissions abatement due to other levers
63%
37%
45%
1,O5O
39%
16%
Energy efficiency
improvements
1,676 Mn
tonnes
CO2eq
1OO%
Energy mix transition
(100% renewables transition
in material processing,
garment manufacturing and
retail operations stages)
Energy mix transition
(switching from coal to electric
in material processing stage)
ENERGY RELATED EMISSIONS ABATEMENT

-41
-39 -5
-52
-158
-12
Total
accelerated
abatement
potential
Improved
material
mix
Increased
use of
Sustainable
Transport
Improved
packaging
Decarbonised
retail
operations
Minimised
returns
Reduced
overproduction
1‚676
18%
61%
Mn tonnes
CO2Eq
Upstream Production
Brand Operations
Usage & End-of-use
EMISSIONS SAVINGS WITHIN BRAND OPERATIONS UNDER ACCELERATED ABATEMENT
21%
12 — 52
REDUCING EMISSIONS FROM BRANDS’ OWN OPERATIONS
DECARBONISATION LEVERS WITHIN BRANDS’
DIRECT OPERATIONS CAN DRIVE AS MUCH
AS 18% OF THE ACCELERATED
ABATEMENT POTENTIAL.
This is achievable through measures
that include rapid digitisation,
investments in more demand-
focused regional supply chains and
nearshoring.
48
Additionally, it
assumes 90% electrification of the
B2C light transport fleet, supported
by regulatory incentives and
improvements in battery technology.
Improved packaging could deliver
5 million tonnes of GHG emissions
savings. This assumes material
mix improvements, such as a
20 percentage point increase
in recycled content usage in
corrugated boxes and 80% recycled
low-density polyethylene content in
polybags through improved material
functionality and lower production
costs. Additionally, it assumes
weight reduction in corrugated
boxes based on a cut in the number
of layers from five to three, and
a reduction in polybag weight by
around 20% through improved design.
Decarbonised retail operations
could deliver 52 million tonnes of
GHG emissions savings. This assumes
a 40% reduction in energy consumption
across heating, ventilation and air
conditioning equipment in retail
operations, an 80% energy efficiency
improvement by switching to LED lighting
and a transition to 100% renewable
energy across retail operations.
Minimised returns could deliver
12 million tonnes of GHG emissions
savings. This assumes a reduction
in e-commerce returns rates from
35% to 15%, through a combination
of technological improvements on
predicting size and fit and consumer
behavioural change to reduce
purchases with an intent to return.
49
Reduced overproduction is a key
lever that could reduce emissions
by around 158 million tonnes in
2030. Due to overproduction, some
40% of garments are currently sold
at a markdown.
50
A 10 percentage
point reduction in industrywide
overproduction,
51
for example through
technology investment to support
demand forecasting and stock
management or regulatory incentives,
could deliver this abatement.
52
Improved material mix could
deliver 41 million tonnes of GHG
emissions savings. The impact of
this lever will be dependent on
the level of adoption assumed. Due
to limitations around economics
and scaling, this accelerated
abatement analysis assumes just 20%
of recycled polyester (rPET) usage
and an 11% adoption of alternatives
such as organic, recycled or bio-
based textiles by 2030 (see:
Embracing sustainable materials).
Increased use of sustainable
transport could deliver 39 million
tonnes of GHG emissions savings.
This assumes a recalibration to
90% sea transport and 10% air
transport across the industry,
compared with 83% sea transport
and 17% air transport at present.
47

13 — 52
EMBRACING SUSTAINABLE MATERIALS
Sustainable materials help reduce upstream emissions,
for example due to cleaner production processes or
use of recycled materials over virgin materials.
Organic cotton is around 50% less emissions intensive
than conventional cotton, due to the limited use of
pesticides and fertilisers and more advanced farming
practices.53 rPET is around 40% less emissions intensive
than regular polyester because of material recycling
and closed-loop production methods.54 Sustainable man-
made cellulose fibres like Modal and Lyocell produce
around half the emissions of conventional fibres of
this type due to closed-loop production methods.55
The net emissions abatement potential of sustainable
materials is dependent on the level of adoption, and
there are challenges in that respect. In the case of
organic cotton, the yields in the transition phase
toward organic certification are lower compared to
conventional cotton. This has a direct impact on
farmers’ revenues. If brands and suppliers cannot
compensate for that loss, organic cotton production
is unlikely to increase significantly over the
next decade. In the case of rPET, the industry has
historically been dependent on rPET from plastic
bottles, but supply is increasingly pressured by
demand from the packaging industry. This could limit
the fashion industry’s share of rPET to around 20% in
2030. Alternative material choices include bio-based
polyester and closed-loop rPET, but commercial-scale
solutions are nascent and cost prohibitive for many
players. Similarly, in the case of sustainable man-
made cellulose fibres, commercial-scale production is
limited due to nascent recycling technology.56
A key unlock over the coming years will be the ability of
industry players to scale up the adoption of sustainable
materials while driving down costs in comparison to
traditional materials, as well as fostering changes
in designer mindsets to promote sustainable materials
in product design. More frequent use of sustainable
materials will also have an impact on other factors,
including water consumption, water pollution, land
and fertiliser use, and eutrophication. That is why
it should continue to be a priority abatement lever as
the technology matures.

14 — 52
ENCOURAGING SUSTAINABLE CONSUMER BEHAVIOURS
half of loads at below 30
degrees,
and substituting every sixth dryer
usage with open-air drying. This
requires brands and retailers to
adapt their offerings, for example
through better care instructions
and sustainable material choices.
Increased recycling and collection
could drive annual emissions
abatement of around 18 million
tonnes. These levers would reduce
incineration and landfill, moving
the industry towards a closed-loop-
recycling (CLR) operating model. CLR
is a key topic within circularity.
Currently less than 1% of used
products are recycled back into the
fashion industry’s value chain.
58
To achieve accelerated abatement,
“AROUND 21% OF ACCELERATED ABATEMENT
POTENTIAL IS DIRECTLY RELATED TO
CONSUMER ACTIONS IN THE USE PHASE AND
END-OF-USE PHASE, ENABLED BY CONSCIOUS
CONSUMPTION AND NEW INDUSTRY BUSINESS
MODELS”
“BY 2030, WE NEED TO
LIVE IN A WORLD IN WHICH
1 IN 5 GARMENTS ARE
TRADED THROUGH CIRCULAR
BUSINESS MODELS.”
Circular business models, including
fashion rentals, re-commerce, repair
and refurbishment could enable the
industry to cut around 143 million
tonnes of GHG emissions in 2030.
57
Consumers are vital to realising
this abatement potential. The
analysis found that, to align with
the 1.5-degree pathway, by 2030 we
need to live in a world in which one
in five garments are traded through
circular business models (see:
Promoting circular business models).
Reduced washing and drying could
deliver an additional 186 million
tonnes of reductions if consumers
changed their behaviour in the use
phase, for example by skipping
one in six washing loads, washing
we expect advancements in chemical
textile-to-textile recycling, the
development of sorting and textile
blend identification technologies,
higher incentives for brands to
enable CLR and consumers to support
this adoption.
-143
-186 -18
Increased use
of circular
business models
Reduced
washing
and drying
Increased
recycling
and collection
1‚676 21%
Total
accelerated
abatement
potential
61%
18%
EMISSIONS SAVINGS WITHIN USAGE AND END-OF-USE UNDER ACCELERATED ABATEMENT
Upstream Production
Brand Operations
Usage & End-of-use
Mn tonnes
CO2Eq

15 — 52
PROMOTING CIRCULAR BUSINESS MODELS
Circular business models are key
decarbonisation levers because of
their ability to extend product
life, enable recycling and reduce
the need for new and finite resources
in production. Circular approaches
could deliver around 143 million
tonnes of GHG emissions savings in
2030, with every percentage point
increase in market share saving
around 13 million tonnes. Beyond
2030, the adoption of circular
business models will need to
continue to grow for the industry
to stay on the 1.5-degree pathway.
The primary vehicle for circular
models is currently re-commerce,
representing around 7% of
the market.
59
Still, over the
coming decade, resale segments,
including consignment shops,
managed marketplaces and peer-
to-peer marketplaces, could grow
at over 10% the compound annual
growth rate (CAGR),
60
amid soaring
demand among GenZ and Millennials
consumers who support the models’
eclecticism, value proposition and
sustainability.
61
Re-commerce will
likely represent 12% of the market
by 2030, based on the accelerated
abatement analysis.
GenZ and Millennials, particularly
those living in urban areas, are
expected to drive the demand for
rental models.
62
Conversely, brands
will be key players in driving
refurbishments as they innovate
around overstock and deadstock.
63
Similarly, the repair lever assumes
the willingness of brands and
retailers to introduce professional
repair services in select product
categories
64
and that consumers
will choose to repair products when
supported to do so.
65
The analysis assumes that re-
commerce models can extend average
product life by 1.7x, based on
average length of second-hand
ownership.
66
The rental model is
assumed to extend product life by
1.8x, based on the average number
of rentals during a product’s
lifetime.
67
Repair models offer a more
modest 1.35x extension, assuming
professional repairs.
68
Finally,
refurbishment has the potential
to double lifetime extension,
reflecting potential brand and
manufacturer collaborations around
up-cycling.
To achieve accelerated abatement,
brands will need to reimagine, and
potentially recalibrate, their
business models. Rental and re-
commerce models, for example, will
require new logistical capabilities.
Repair and refurbishment models
will require garment-making skills,
either inhouse or outsourced. As
demand grows, brands will need to
implement circular business models
in collaboration with retailers
and upstream value chain players or
risk losing both control of their
products and the value they hold
after sale

16 — 52
~7% ~2O% ~3O%
1% increase in
circular model market
share reduces emissions
by 13 Mn tCO2e
Circular model
market share
Circular model
market share
Circular model
market share
1,963
2,1O4
1,772
Mn tonnes
CO2Eq
1,OOO
O
2,OOO
EMISSIONS SENSITIVITY TO CIRCULAR
BUSINESS MODEL ADOPTION
“AS DEMAND GROWS,BRANDS WILL NEED TO
IMPLEMENT CIRCULAR BUSINESS MODELS
IN COLLABORATION WITH RETAILERS AND
UPSTREAM VALUE CHAIN PLAYERS OR
RISK LOSING BOTH CONTROL OF THEIR
PRODUCTS AND THE ADDITIONAL VALUE
THEY HOLD AFTER SALE.”

17 — 52
THE ECONOMICS OF EMISSIONS ABATEMENT
THIS REPORT QUANTIFIES THE ECONOMICS OF
ACCELERATED ABATEMENT, COMPARING NECESSARY
INVESTMENTS AND RESULTING SAVINGS, BASED ON
A HOLISTIC FASHION INDUSTRY GHG EMISSION
ABATEMENT COST CURVE.
THE CURVE, WHICH IS ALREADY WIDELY USED
IN OTHER INDUSTRIES, HIGHLIGHTS POTENTIAL
ABATEMENT LEVERS AND QUANTIFIES THEIR
IMPACTS AND COSTS.
IN ESTABLISHING THE COST CURVE, THE REPORT
AIMS TO SPARK INDUSTRY-LEVEL DIALOGUE AROUND
POWERFUL DECARBONISATION LEVERS AND SUPPORT
INDIVIDUAL BRANDS IN DEFINING THEIR OWN
ABATEMENT CURVES AND ROADMAPS.

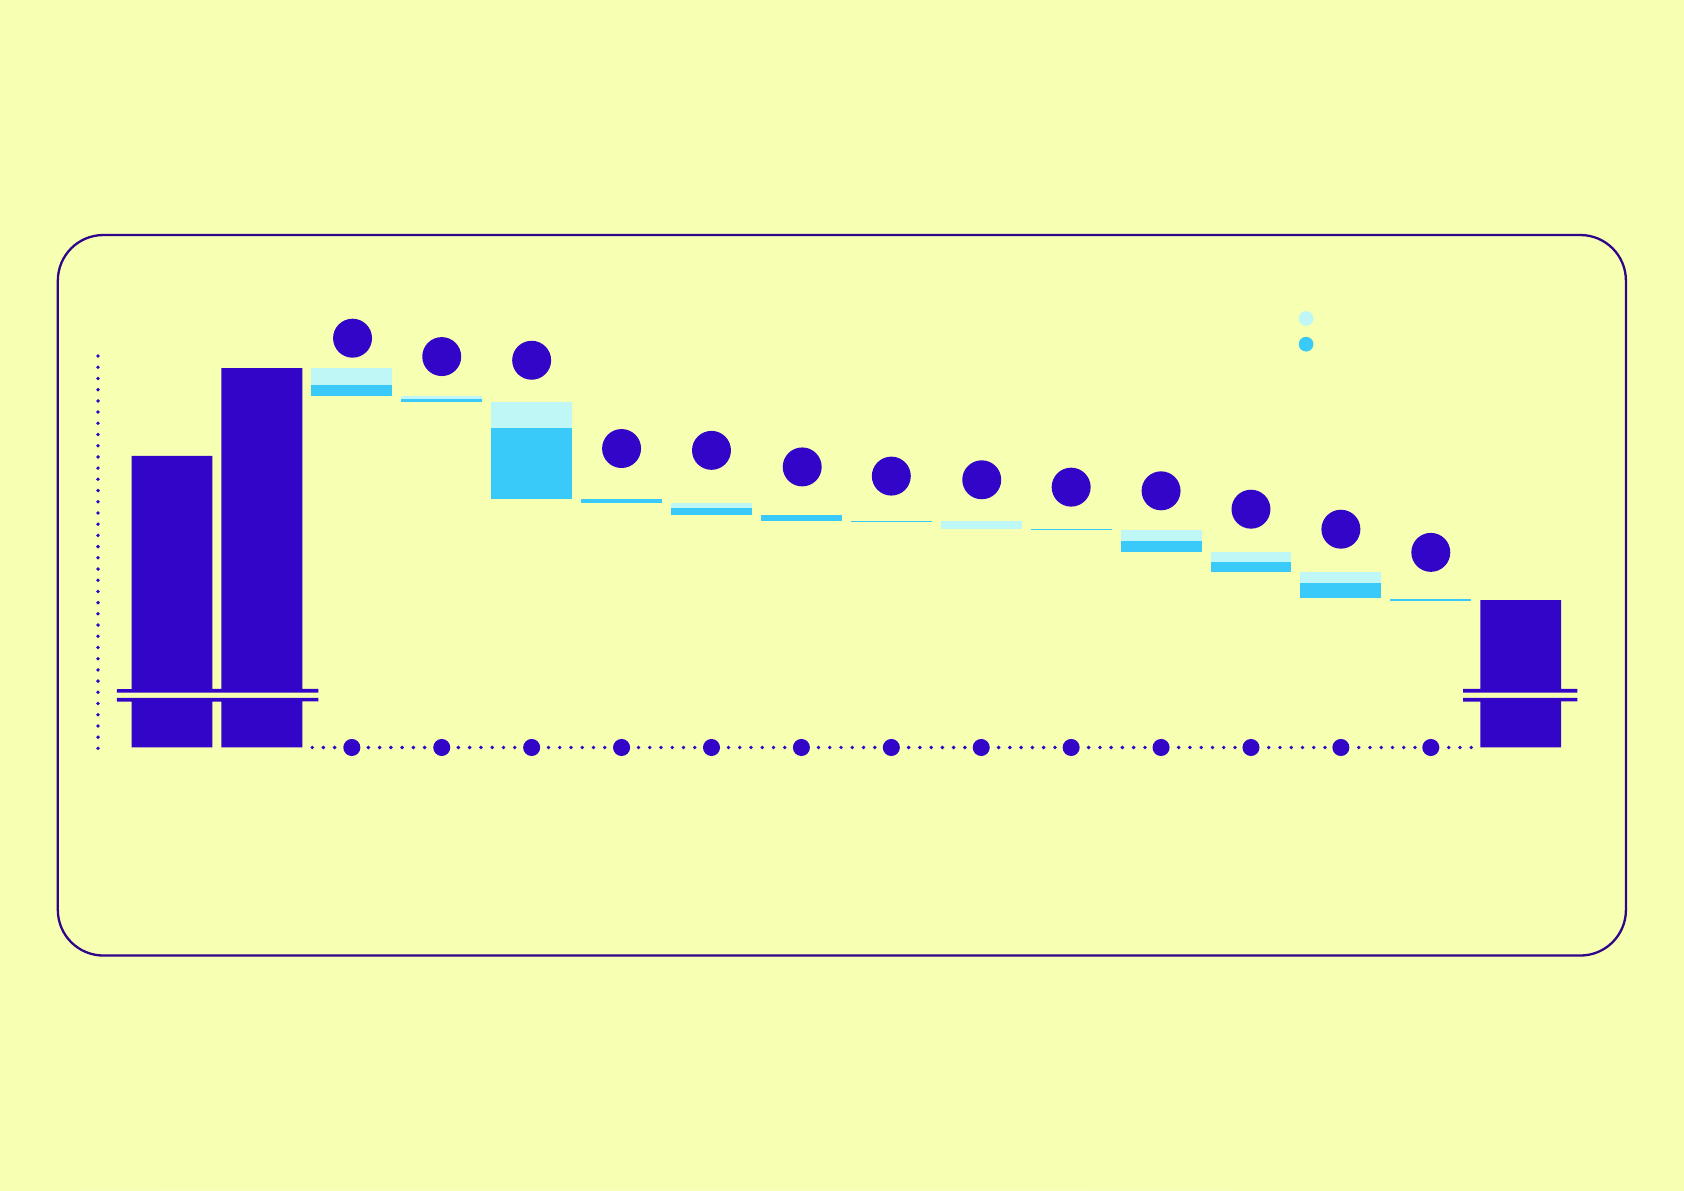
+1OO
+2OO
USD/tCO2e
Mn tCO2e
-1OO
1OO
13
2OO 3OO 4OO 5OO 6OO 7OO 8OO 9OO 1OOO 11OO 12OO 13OO 14OO 15OO 16OO 17OO
-2OO
-3OO
-4OO
-5OO
-6OO
-49OO
Cost
Cost Savings
~3% rental
market share
from <1%
8a
8b
Reduced polybag
usage (1:2) and
corrugated box spec.
reduction to 3ply
8O% recycled
content in corru-
gated boxes from
current 5O% & 1OO%
recycled polybags
from current ~2O%
1O
~15% e-commerce
returns rate
from 35%
11
Reducing over-
production rate
from 2O% to 1O%
9b
~4O% energy
efficiency improve-
ment in HVAC & 8O%
improvement in
lighting in retail
operations
6
Reduction in wastage
during garment produc-
tion from 14 to 12%,
increased CLR rate
to 1O%
1OO% renewables
energy in consump-
tion countries
1OO% renewables
energy in garment
manuf. countries
~3O% rPET usage
from ~15%
Improvement in EOL recy-
cling rate from 17% to
3O% and increased CLR
rate from ~1% to 5%
~1O% organic cotton
usage from ~1% and
improved MMCF usage
~1O% from current 6%
~2O% energy efficien-
cy improvements in
Polyester production
16
4
9a
5a
2b
17
1a
~15% reduction
in washing
frequency, 5O%
of washes <3O˚C
and reduced
dryer usage
~1% scrap reduction
in fabric manuf.
from currently 12%
7b
9O/1O split
between sea
vs. air
transport from
83/17
14 15
~2% refur-
bishment
market share
from <1%
Extending
average
usage by 1yr
through
repairs from
3y to 4y
12 3b2
~8O% energy
efficiency
improvement in
wet processing
5b
~3O% energy
efficiency improve-
ment in HVAC, 8O%
in lighting and 2O%
in sewing machines
during garment
production
3b1
~1O% energy
efficiency improve-
ment in spinning &
weaving & knitting
7a
1b
~4O% reduction
in fertilizer/
pesticides usage
in cotton manuf.
3a
1OO% renewables
energy in production
countries
FASHION INDUSTRY COST CURVE UNDER ACCELERATED ABATEMENT
~12% re-com-
merce market
share from ~7%
~9O% electri-
fication of LM
transport to
BEVs from 3O%
2a
Upstream Production
Brand Operations
Usage & End-of-use
18 — 52
19 — 52
THE ECONOMICS OF EMISSIONS ABATEMENT
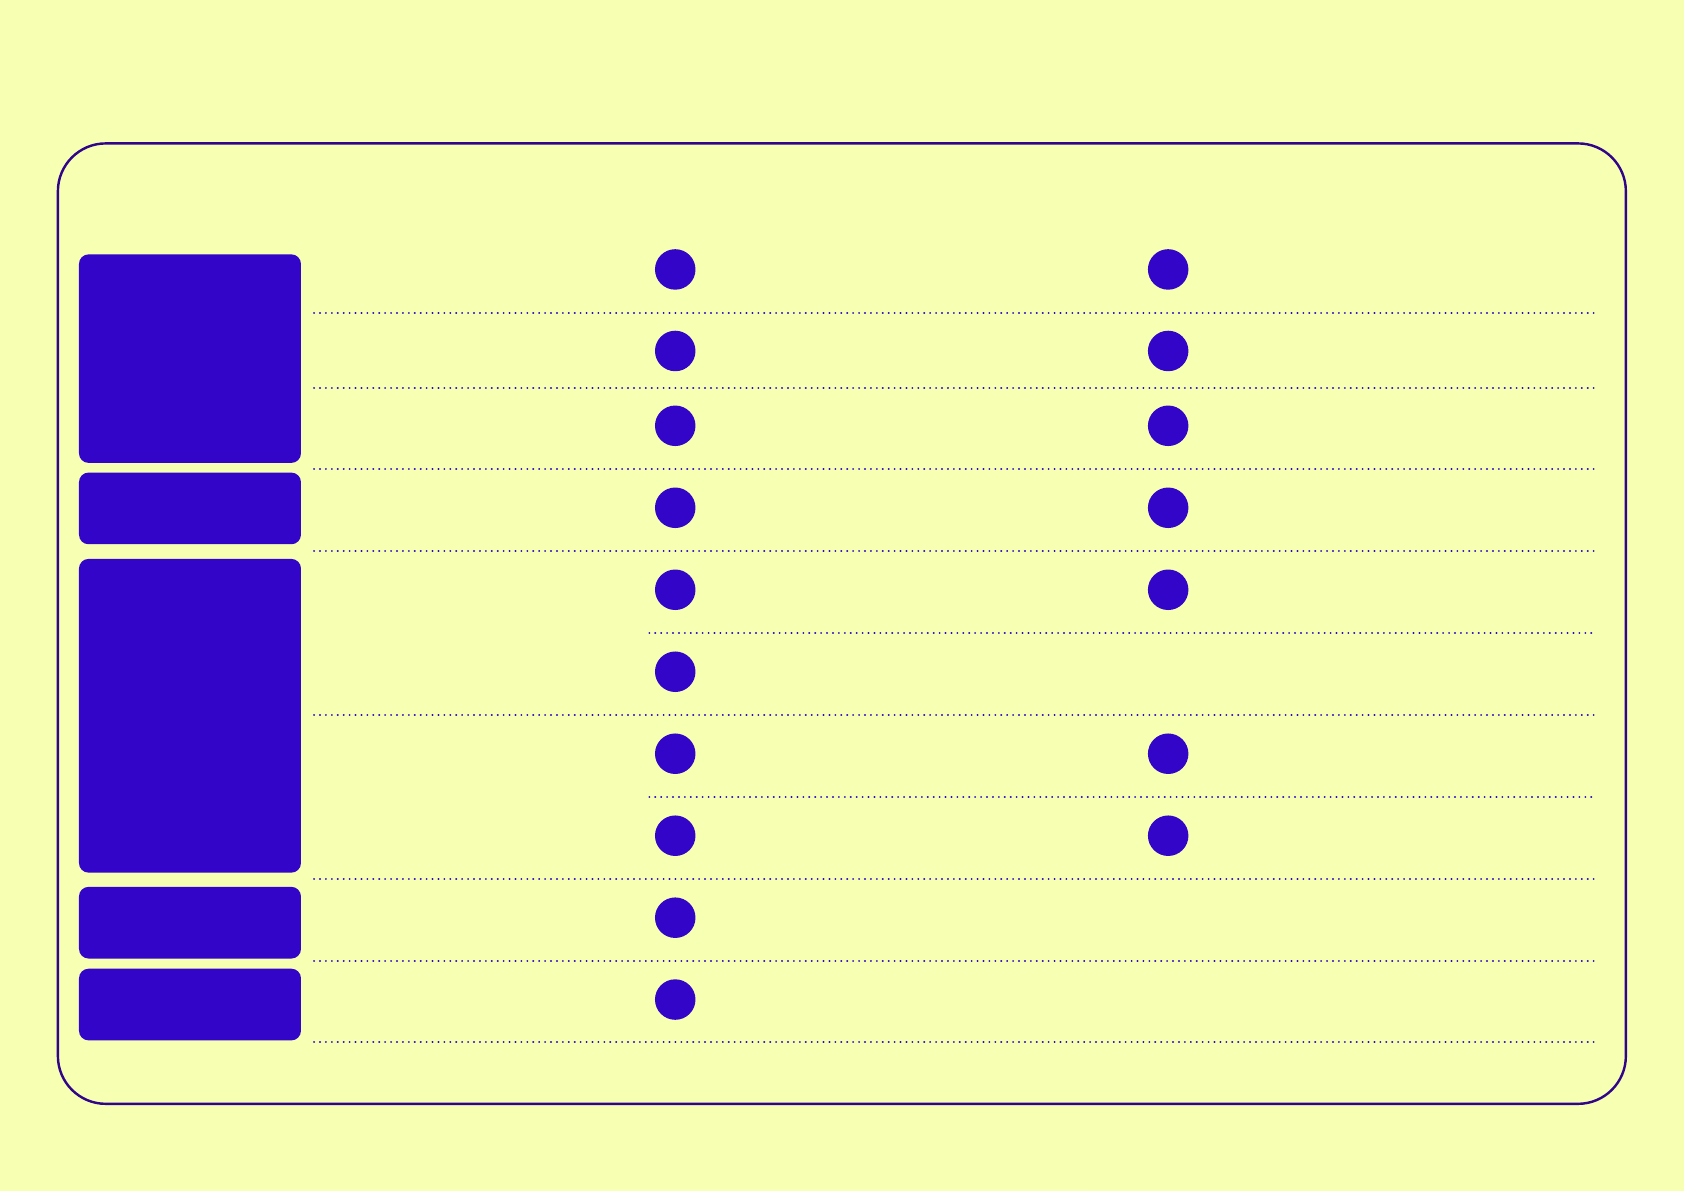
HOW TO READ A COST CURVE
To understand the economics behind the decarbonisation levers, we use an industry-level cost curve analysis. This tool enables a visualisation
of lever abatement potential and economics, providing an integrated perspective on economic viability. The cost curve looks different for each
stakeholder and brand, depending on product mix, sourcing country, and historical abatement progress. It encompasses the end-to-end value
chain, from material and garment production to retail, product use and end-of-use. It does not incorporate effects such as the GHG emissions
from fashion shows and the back-office operations of individual companies.
Each bar on the cost curve represents a decarbonisation lever. The bar width represents the abatement under that lever in one year. The costs on
the y-axis are calculated as annual additional cost savings or spending required to save 1 tonne of GHG emissions through a given lever.
69
They
include an annualised depreciation charge relating to the upfront capital expenditure (capex) needed to implement the lever, where applicable.
A negative value on the y-axis indicates levers are cost savings (e.g. USD100 cost savings per every tonne of GHG emissions abated through
the lever), while a positive y-axis value indicates additional costs to achieve the level of abatement.
Width of the bar is the
emissions reduction poten-
tial by the newlever
in a given year
2
Abatement cost is calcu-
lated as the difference
of average costs between
new and replaced lever
divided by the displaced
emissions
1
Abatement cost
USD per tCO2e
4
Each field represents
one abatement lever to
reduce emissions
1
Height of the bar is the
annual abatement cost to
reduce emissions by 1 tCO
2
e
with this lever
3
Levers are sorted by increasing
abatement costs for the reduc-
tion of emissions by tCO2e
5
Negative Y-axis
indicates levers are
cost savings for the
party implementing
the measures (e.g.
$1OO cost savings
per every tonne of
CO2e abated through
this lever)
6
Positive Y-axis indi-
cates additional costs
for the party imple-
menting the measures
(e.g. $8O additional
cost incurred per every
tonne of CO2e abated
through this lever)
7
8O
-1OO
HOW TO READ A COST CURVE

20 — 52
The good news for the industry is that around
55% of the levers required to achieve the
accelerated abatement of 1.7 billion tonnes of
GHG emissions in 2030 generate savings on an
industrywide basis.
For example, using 90% sea and 10% air
transport, achievable through increased process
digitisation, better planning and regional
supply chains or nearshoring, could deliver
more than USD600 of cost savings per tonne of
GHG emissions abated. Reducing polybag use by
half and capping corrugated boxes at three ply
can deliver similar savings. Cutting the rate
of e-commerce returns from the current 35% to
15%, for example through data-driven analysis of
consumer purchasing behaviours and standardised
sizing guidelines, can save nearly USD360 per
tonne of GHG emissions abated.
Some abatement levers create costs that outweigh
their savings. The increased use of sustainable
materials is likely to incur positive costs
given current technologies and resulting
economics. Recycled polyester (rPET) fabric is
likely to incur costs in the range of USD60 per
tonne of GHG emissions abated. A 15 percentage
point improvement in end-of-use recycling is
likely to incur costs of around USD140 per tonne
of GHG emissions abated. Still, 89% of abatement
can be achieved at a cost of less than USD50
per tonne of GHG emissions, a relatively modest
amount compared with other industries.
70
“ABATEMENT
REQUIRES INVESTMENT,
BUT AROUND 55% OF THE
LEVERS SAVE MONEY
FOR THE INDUSTRY
OVERALL.”
THE ECONOMICS OF EMISSIONS ABATEMENT

21 — 52
The likelihood that any particular lever will
be implemented is not solely determined by
its cost. There may be other factors at play,
including misalignment of incentives, impact
on brand image, joint commitments or regulatory
requirements. The transition to renewable
energy is likely to incur around USD20 per
tonne of GHG emissions abated costs, mainly
due to the upfront capex required for back-up
battery storage and other infrastructure.
However, this could be offset by government or
brand-led incentives (see: Energy transitions).
End-of-use recycling requires sizeable upfront
capital investment, both to develop CLR
technology and to build recycling infrastructure.
Regulatory incentives such as the European
regulation on waste recycling and reuse under
the Waste Framework Directive may support
investment.
71
Equally, the promise of cost
savings is not a guarantee of implementation
feasibility. A requirement for significant
upfront capital allocation may, for example act
as a disincentive. In these situations, value-
sharing arrangements among value chain players
can help re-align the incentives required to
catalyse action.
On the fashion industry abatement cost curve,
around 60% of the accelerated abatement requires
upfront capex, of which around 30% leads to a
cost savings net of the investment requirement.
Most levers in this category are focused on
energy efficiency, where accrued savings outweigh
the initial investment. However, given the
fragmented nature of the value chain, individual
companies may not be able to afford sizeable
upfront investments by themselves. In these
THE ECONOMICS OF EMISSIONS ABATEMENT
“GIVEN THE FRAGMENTED
NATURE OF THE
UPSTREAM FASHION
INDUSTRY VALUE CHAIN,
COLLABORATION IS
NEEDED TO FINANCE
UPFRONT INVESTMENTS.”
scenarios, brands and retailers may consider
co-financing solutions or sharing financial
incentives to distribute the potential savings.
Despite the economics, around a fifth of abatement
measures, including the adoption of circular models,
reduction in washing and drying frequency, as well
as end-of-use recycling, are primarily contingent
on consumer choice. At a minimum, these levers will
require a change in behaviour beyond the intention
to support decarbonisation efforts. Recent consumer
sentiment surveys indicate growing support that
could lead to real action.
72
However, brands should
do as much as possible to offer a compelling
proposition, for example through innovative business
models to encourage participation in circular models
and end-of-use recycling.

22 — 52
ROLES OF ECOSYSTEM ACTORS TO REACH THE 1.5-DEGREE PATHWAY
BASED ON THE ANALYSIS, THERE ARE PRODUCTIVE AND COST-EFFECTIVE
STRATEGIES THAT CAN PROPEL THE INDUSTRY TOWARDS LOWER GHG
EMISSIONS. PLAYERS MUST CONTINUE CURRENT EFFORTS, FROM MODERNISING
AND DECARBONISING OPERATING MODELS, TO ENGAGING WITH CONSUMERS,
SUPPORTING VALUE CHAIN TRANSFORMATIONS AND PURSUING COLLECTIVE
SOLUTIONS. MOREOVER, BRANDS HAVE A ROLE TO PLAY IN DRIVING VALUE
CHAIN DECARBONISATION THROUGH EQUAL PARTNERSHIPS WITH OTHER
STAKEHOLDERS.
BRANDS AND RETAILERS
Prioritise emissions transparency and set targets.
In addition to continuing existing efforts to
drive decarbonisation, brands and retailers should
prioritise transparency and should track, analyse
and benchmark performance in their own operations.
As a starting point, brands and retailers should
analyse their own specific abatement curves, which
will help them focus on key levers and define
or adjust their decarbonisation roadmaps. They
should set science-based targets in line with
the Paris Agreement and develop clear timelines
and governance structures that will support
operationalisation of climate strategies.
73
Engage in transparent consumer communication.
Brands and retailers should leverage existing
joint initiatives to set standards on labelling
and provide digestible information to consumers at
point of sale.
74
Transparent communication about
challenges and successes are likely to increase
brand loyalty and foster consumer engagement.
Introduce circular business models. Brands and
retailers also have a role to play in enabling
levers such as circular business models. If brands
are able to engage with consumers about their
expectations and needs, for example in relation
to demand for durable, high-quality, recyclable
products, there is an opportunity to expand market
share in the growing circular business segment.
75
Drive sustainable product design and innovation.
Additionally, brands should drive sustainable
decision-making at the design stage, with the
aim of driving sustainable material usage,
minimising production waste and encouraging end-
of-use recycling. On an industrywide basis, brands
and retailers should consider pre-competitive
investment in research-dependent areas such as
alternative materials.
“TARGETS NEED TO BE
SET BY BRANDS AND
RETAILERS FOLLOWING A
COMMON STANDARD AND
IN COLLABORATION WITH
THEIR UPSTREAM PARTNERS
TO ENSURE CONSISTENT
ACTIONS ARE TAKEN TO
ACCELERATE INDUSTRY
DECARBONISATION
EFFORTS.”

23 — 52
UPSTREAM VALUE CHAIN PLAYERS
Coordinate decarbonisation efforts. Factories,
material producers and other upstream players
must be fully involved in and committed to
decarbonisation programmes. Brands and retailers
should support value chain players in tracking,
analysing and benchmarking their carbon emissions
and enhancing transparency. Useful tools include
abatement cost curves and the Higg Facility
Environmental Module.
76
Moreover, brands and
retailers should aim to coordinate their
decarbonisation efforts with key value chain
partners to ensure alignment in targets and actions.
Standardised target setting could help minimise
inefficiencies and help value chain players deliver
coordinated decarbonisation activities.
Develop equal partnerships. Brands and value chain
stakeholders have an opportunity to work closely
and develop equal partnerships, particularly by
assessing purchasing practices and incentivising
value chain players on decarbonisation activities.
Following COVID-19, all stakeholders have an
opportunity to re-prioritise relationships
with partners who are similarly committed to
sustainable practices.
Collaborate on energy transition efforts. Brands
have a key role to play in supporting the
implementation of efficiency improvements along
the value chain. Co-investment and sharing of
financial incentives through long-term partnerships
are potentially effective strategies to drive
change. Brand support can also be instrumental in
facilitating the transition to renewable energy,
particularly in key supply countries.
POLICY MAKERS
Drive sustainable practices and consumption.
Policy makers have a vital role to play in
driving decarbonisation across the industry, and
governments have already begun incentivising
sustainable practices and responsible consumption.
For example, in 2019, the European Commission
communicated the European Union (EU) Green Deal
policy framework to accelerate decarbonisation
across member states.
77
Also, in 2019, France
announced a ban on the destruction of unsold
fashion goods, to be implemented by 2023.
78
ROLES OF ECOSYSTEM ACTORS TO REACH THE 1.5-DEGREE PATHWAY
Incentivise key decarbonisation levers.
Additionally, policy makers can play a role in
supporting specific levers and driving investment.
For example, the 2020 EU Circular Economy Action
Plan lays out a policy framework to support
sustainable products, services and business
models that reduce waste production, including
levers such as landfill and incineration taxes
and requirements for recycled content that will
stimulate the development of the EU market for
secondary raw materials.
79
Engage with industry players. Going forward,
similar to efforts at the 2019 United Nations
Framework Convention on Climate Change (UNFCCC)
COP 25 conference in Madrid,
policy makers have an
opportunity to increase engagement with industry
players, enabling them to shape views on emissions-
related topics and to support policy making and
regulation that will enable accelerated abatement.
80

24 — 52
INVESTORS
Encourage decarbonisation efforts. Due to the
positive link between environmental, social
and governance (ESG) performance and financial
performance, ESG factors are playing an
increasingly prominent role in decisions around
mergers, acquisitions, and divestitures.
81
,
82
Investors therefore have an inherent interest in
driving their portfolio companies towards accelerated
abatement, adoption of science-based targets and
accountability on decarbonisation efforts.
Drive emissions transparency within portfolio
companies. Investors should encourage transparency
on full value chain emissions and promote the use of
standardised sustainability assessments such as the
Higg Brand and Retail Module within their portfolios.
Support sustainability focused innovation.
Additionally, investors can allocate capital
towards innovative players looking to develop
solutions towards key decarbonisation challenges
such as closed loop recycling (CLR), towards
sustainable material development and also demand
prediction models that can reduce overproduction.
CONSUMERS
Act on sustainability intentions. Consumers
must play their part in driving industry
decarbonisation efforts through their purchasing
decisions. When provided with information,
consumers may prefer products with lower emissions
footprints, such as those made with low-carbon
materials. Consumers can also embrace circular
business models to extend the life of fashion
products and reduce production-related emissions.
Adopt sustainable usage and end-of-use behaviours.
During the use-phase, consumers can take better
care of products by reducing washing and drying.
ROLES OF ECOSYSTEM ACTORS TO REACH THE 1.5-DEGREE PATHWAY
This improvement in behaviour can deliver as
much as an 11% abatement in emissions under the
accelerated abatement scenario. Consumers also
have a role to play in recycling products, which
can reduce incineration and landfill, and promote
CLR across global markets.

25 — 52
BEYOND 2030: DECOUPLING VALUE FROM VOLUME GROWTH
In 2030, almost 62% of remaining GHG emissions (659 million tonnes)
after accelerated abatement levers have been applied, are likely
to come from the raw material production of the value chain, where
abatement is especially difficult without a move towards fully
organic materials and at-scale adoption of sustainable materials.
83
To remain on the 1.5-degree pathway beyond 2030, the industry will
need to think radically and embrace business model transformation
to deliver sustainable outcomes.
Brands and retailers will need to decouple from the current volume-
driven measures of success and unlock new sources of value through
collaboration with their value chain partners. Increased investor
focus on companies with clear ESG value propositions is already
encouraging companies to consider new definitions of success.
84
For example, brands and retailers could offer products that are
made to order, which would reduce the volume of garments that can
only be sold at significant discounts and thereby add volume, and
emissions, without contributing much value. If the industry could
reduce the share of stock sold at a discount by 15 percentage
points, it would achieve a volume and emissions decline of about
10% without any impact on value growth.
Similarly, companies could decouple volume growth from value growth
by enabling the acceleration of circular business model adoption.
The accelerated abatement analysis assumes volume growth in line
with industry forecasts and an increase of circular business model
market share to around 20%. This implies a volume growth of around
2.1% per annum, compared with a 2.7% per annum if the circular
business model adoption stays at current levels. However, with
a clear consumer value proposition, which could drive margins
similar to existing business models, brands can continue to capture
value from the circular models without the growth in volume and
resulting emissions.
To remain on the 1.5-degree pathway, the industry would need to
imagine a world with smaller individual wardrobes consisting of
higher value, longer life pieces, complemented by a flourishing
re-commerce and rental market, and ample access to repair and
refurbishment services. While volume growth in this world could
taper, these new consumer needs provide significant value capture
opportunities for players who can combine deep customer insight
with the capacity to change their way of serving customers.

26 — 52
THE FASHION INDUSTRY’S SUBSTANTIAL CONTRIBUTION TO GLOBAL
GHG EMISSIONS ALSO CREATES AN OPPORTUNITY TO INSTITUTE REAL CHANGE.
IN A POST-COVID-19 WORLD, THERE IS A CHANCE FOR BRANDS TO TAKE
RESPONSIBILITY, UNDERSTAND THEIR OWN EMISSIONS AND ABATEMENT LEVERS,
COLLABORATE WITH PARTNERS TO DECARBONISE THE VALUE CHAIN AND WORK
WITH STAKEHOLDERS TO BUILD A LESS EMISSIONS-INTENSIVE PRODUCT
LIFECYCLE. THIS WILL BECOME CRITICAL BEYOND 2030, WHEN THE INDUSTRY
NEEDS TO FIND NEW WAYS TO DECOUPLE VOLUME GROWTH FROM VALUE GROWTH TO
STAY ON THE 1.5-DEGREE PATHWAY. IN AN HISTORIC YEAR, THE ECONOMIC AND
ETHICAL DRIVERS HAVE NEVER BEEN STRONGER. WHICH IS WHY NOW IS THE
TIME FOR DECISION MAKERS TO DEEPEN THEIR UNDERSTANDING OF GHG
EMISSIONS AND TO ACCELERATE THEIR RESPONSE.

27 — 52
APPENDIX: METHODOLOGY AND ENDNOTES
KEY DEFINITIONS
Fashion industry: The combined apparel and footwear industry
and its value chain players.
Industry value chain: The analysis looks at the fashion
value chain from raw material production, processing,
manufacturing, transport and retail to product use and end
of use. It does not take into account emissions related to
secondary activities such as fashion shows and the back-office
operations of individual companies in the value chain.
Timeframe: 2018 was established as the baseline year for the
emissions impact calculations. Analysis was then conducted to
forecast annualised emissions in 2030.
Production countries: The analysis uses the top five global
apparel production countries as a proxy for energy consumption
and processing. These countries are China (61% of production),
Vietnam (15%), India (11%), Bangladesh (7%) and Turkey (6%).
85
Consumption countries: The analysis uses USA and EU energy
consumption data across downstream and use phases as proxies
for the consumption countries.
86
GHG emissions: The report uses the CO2 equivalent (CO2eq)
metric measure to compare the emissions from various
greenhouse gases based on their global-warming potential by
converting amounts of other gases to the equivalent amount of
carbon dioxide with the same global warming impact. The metric
unit tonne was used to denote 1,000Kgs of CO2eq units.
No further action: Refers to estimates of potential GHG
emissions over the next decade if the fashion industry
continues production in line with growth forecasts and makes
no additional decarbonisation efforts beyond those in place
in 2018. This establishes a starting point to represent the
industry’s current GHG emissions intensity, scaled to 2030
industry volume growth expectations. It implies 2.7% industry
volume growth (CAGR) through 2030, adjusted for COVID-19
impact on growth.
Current pace trajectory: Refers to estimates of the potential
for emissions reduction if the fashion industry continues
its production in line with growth forecasts and continues
to scale its decarbonisation efforts at the current pace.
This implies 2.3% industry volume growth (CAGR) through
2030, reflecting volume reduction in new production due to
increasing market share from circular business models.
Accelerated abatement: Refers to estimates of the potential
for emissions reduction if the industry continues its
production in line with growth forecasts and significantly
accelerates its decarbonisation efforts across the selected
levers. This is not a forecast of where the industry is
heading but is an analysis of how much additional abatement
could be captured realistically by 2030. It represents the
levers stakeholders should consider today, to both reach the
current trajectory and to accelerate beyond it. The level of
abatement is calculated as the effort required to move from no
further action emissions levels to the accelerated abatement
trajectory. This implies 2.1% industry volume growth (CAGR)
through 2030, reflecting accelerated adoption of circular
business models.
Marginal abatement cost curve: An established tool used to
understand the decarbonisation potential of levers available
within an industry and the economics of the levers by comparing
investments needed against savings and gains. The analysis looks
at the cost curve from a fashion industry standpoint, rather
than the point of view of a single stakeholder.

28 — 52
OVERVIEW OF THE METHODOLOGY
Emissions baseline: This is calculated as a
bottom-up value-chain emissions baselining
exercise that takes into account the volume
of garments produced, used and disposed of in
a given year. The analysis uses the volume of
fibres used to meet garment demand for 2018 and
the energy consumption and emissions intensity
of raw materials per processes involved in each
stage of the value chain.
87
The apparel industry
emissions figure is scaled up to reflect
the combined apparel and footwear industry
emissions based on 2018 emissions split between
the two segments.
88
Industry growth analysis: The analysis is based
on post COVID-19 growth scenarios for the
apparel fashion and luxury sector by McKinsey
Global Institute. The analysis looks at several
growth scenarios, taking into consideration
the severity of the COVID-19 impact, potential
future resurgence, the public health response
and the effectiveness of government economic
interventions. The selected scenario (“virus
contained, growth rebound”) is expected to
have a limited negative impact, with growth
rebounding by Q1 2021. This results in a ~30%
drop in demand in 2020, followed by a growth
rebound of ~3% in 2021 compared to 2019.
2030 1.5-degree pathway target: The fashion
industry’s 2030 emissions pathway of 1.1
billion tonnes of GHG emissions was calculated
based on the 1.5-degree Intergovernmental Panel
on Climate Change (IPCC) report scenario
89
and the bottom-up calculation of the fashion
industry’s share in global emissions (see
Methodology section: Emissions baseline).
As per the IPCC report, half of available
1.5-degree pathways indicate that global
emissions in 2030 should be in the range of
25-30 billion tonnes of GHG emissions. The
mean of this range was used as a base for the
global 1.5-degree pathway. To calculate the
fashion industry’s target, a 4% share of global
emissions
90
was applied to the global target,
which resulted in the 2030 1.5-degree pathway
of 1.1. billion tonnes of GHG emissions.
Abatement cost: This is the cost required to
reduce emissions by 1 tonne of CO2eq using
a selected decarbonisation lever. This is
calculated as the difference of average costs
between a new and replaced lever divided by the
displaced emissions. This takes into account
the annual additional operating cost (including
annualised capex depreciation charges for the
upfront investments) and the potential cost
savings from operations, when compared to the
replaced lever. The calculations do not include
transaction costs, subsidies, explicit CO2
costs, taxes or impact on the economy.
Abatement potential: The analysis looks at
the abatement potential of 17 levers across
the fashion value chain. Within each lever,
assumptions are made about the level of
decarbonisation that could be achieved under both
the current trajectory and accelerated abatement
conditions (see below: Key assumptions).

29 — 52
1 – Fashion industry includes apparel and footwear industries, 2 – Total apparel volume (linear + circular volume demand). Emissions were modeled
under Quantis assumption that apparel makes 83% of total apparel and footwear emissions3 – established as a analytical reference for 2030 emissions
based on expected industry growth rate Source: Consolidated model on 22 June 2020
SUMMARY OF FASHION INDUSTRY
1
ABATEMENT POTENTIAL
Analysis
2O18
Baseline
2,1O6
2,74O
2,1O4
1,O64
+3O%
O%
-5O%
-23%
-6O%
2.7%
2.3%
2.1%
2O3O
No Further Action
3
2O3O
Current Pace Trajectory
2O3O
Accelerated Abatement
Emissions,
Mn T CO2eq
Emissions %
change vs 2O18
Emissions % change vs
2O3O No Further Action
Implied Volume
CAGR
2
30 — 52
ABATEMENT CONTRIBUTION OF ANALYSED DECARBONISATION LEVERS
12%
2%
42%
1%
5%
2%
O%
3%
1%
9%
9%
11%
1%
-2O5
-41
-7O3
-24
-9O
-39 -5
-52 -12
-158
-143
-186 -18
Current pace trajectory
Accelerated abatement
1,O64
2,74O
2,1O6
Decarbonised material
production
2O18
Emissions
2O18
Emissions
under no
action
2O3O
accelerated
abatement
Improved material mix
Decarbonised material
processing
4, 6 Minimised production
& manufacturing wastage
Decarbonised garment
manufacturing
Sustainable Transport
Improved packaging
Decarbonised retail
operations
Minimised returns
Reduced overproduction
Increased use of circular
business models
Reduced washing and drying
Increased recycling
and collection
Mn tonnes
CO2Eq
EMISSIONS ABATEMENT UNDER ACCELERATED ABATMENT
31 — 52
KEY ASSUMPTIONS BEHIND THE ANALYSED LEVERS
1
GARMENT LIFE STAGES POTENTIAL LEVERS
Upstream
value chain
Transport
& distribution
Retail
Product use
End-of-use
Raw material production
2
Material preparation
& processing
Sustainable transport
Washing and drying
Recycling and collection
Product manufacturing
Decarbonised material production
Improvements across the production & cultivation
of key materials e.g. Cotton, Polyester & Viscose
Improved material mix
Decarbonization through improved mix of alterna-
tives for existing materials and introduction of
new materials
3 4
5 6
Decarbonised material processing
Improvements in energy mix and efficiency in
processing
Minimised production wastage
Reducing waste generated in the processing stages
Decarbonised garment manufacturing
Improvements in energy mix and efficiency across
manufacturing countries
Minimised manufacturing wastage
Reducing waste generated in the manufacturing
stages
7 8
Increased use of sustainable transport
Improvements in fuel mix, energy efficiency of
fleets and operational improvements
Improved packaging (manufacturing through retail)
Decarbonization through carbon friendly material
mix and reduction of packaging usage
Operations
New business models
9 11
Decarbonised retail operations
Improvements in energy mix and efficiency across
retail
1O
Minimised returns
Decarbonization by limiting retail returns
(retailer & consumer)
12
Increased use of rentals models
Promotion of subscriptions or one-time rental
offerings
14
Introduction of refurbished / upcycled products
Promotion of re-furbished / upcycled product
offerings
13
Increased use of re-commerce models
Promotion of 2nd-hand sales (direct or through
platforms)
16
Reduced washing & drying
Reduced washes and improved care (e.g. temperature
selection)
17
Increased recycling & collections
Increased recycling & collections to minimize
incineration without recovery and landfill
15
Introduction of product repair services
Promotion of repair services to extend product
life
Reduced overproduction
Reducing waste generated due to unsold stock in
retail

32 — 52
1. De-carbonised material
production: Improvements
across the production and
cultivation of key current
materials
Current pace trajectory
Polyester: ~20% energy efficiency improvements for polyester due to
switch from coal to electric boilers and condensate recovery with
an adoption rate of +20% from current levels
Cotton: ~20% reduction in fertiliser and pesticides usage due to
targeted pesticide use and improved farming practices
Accelerated abatement
Polyester: ~20% energy efficiency improvements for polyester due to
switch from coal to electric boilers with an adoption rate of +40%
from current levels
Cotton: ~40% reduction in fertiliser and pesticide usage due to
substantially improved sustainable farming practices
Institut für Textiltechnik, RWTH
Aachen University; Economic Research
Service, United States Department of
Agriculture
Economics
Increased operating costs in polyester production due to annual
capex charge for 100KW capacity boilers with 15-year lifetime,
partially offset by the efficiency gains in substituting coal
boilers (70% efficiency) for electric boilers (95% efficiency);
accelerated replacement rate assumed, with 50% of the lifetime
remaining on coal boilers.
Cotton: operating cost savings from reduced fertiliser and
pesticide use was incorporated
McKinsey & Company, Sustainability
Insights team; UK Department for
Environment, Food and Rural Affairs,
2007; Federal Reserve: Economic
Data, 2018
LEVER NAME KEY ASSUMPTIONS SOURCES
1. DE-CARBONISED MATERIAL PRODUCTION

33 — 52
2. Improved material mix:
De-carbonisation through the
use of alternative or new
materials
Current pace trajectory
Assumptions based on historic adoption rates and major player
commitments, i.e., organic cotton overall market share of ~1%,
recycled cotton market share of <1%, rPET market share of ~13% and
bio-based synthetics market share of <1%. Total man-made cellulose
fibres share of ~7%.
Accelerated abatement
Organic cotton overall market share of ~2%: this takes into account
reduced production and certification costs due to economies of
scale and significant leading player commitments to fund the
transition phase
Recycled cotton market share of ~1% assuming improvements in
recycling technologies. Sustainable man-made cellulose fibres (e.g.
Modal, Lyocell) market share of ~5%, replacing conventional cotton
demand due to lower yield arising from organic cotton transition
rPET market share of 20% assuming growth in mechanical recycling
and technology driven economies of scale in chemical recycling
Bio-based synthetics market share of ~3% assuming regulatory
interventions
Textile Exchange: Organic Cotton
Market Report, 2019; Institut
für Textiltechnik: RWTH Aachen
University; Citi Research: Global
Apparel Retail, 2020; Independent
Commodity Intelligence Services
Economics
Increased operating costs due to higher price of organic cotton
compared to regular cotton and rPET and bio-based synthetics
compared to regular synthetics
Federal Reserve: Economic Data,
2019; IHS Markit database,
historical data
2. IMPROVED MATERIAL MIX
LEVER NAME KEY ASSUMPTIONS SOURCES

34 — 52
3. Decarbonised material
processing:
Improvements in energy
efficiency, transition to
renewable energy and reduced
chemical use
Current pace trajectory
Energy efficiency assumes ~5% energy consumption improvement for
spinning, weaving and knitting through motor and air pressure
improvements with +20% adoption rate; ~80% efficiency improvement
in wet processing with an adoption rate of +15% of condensate
recovery improvements
Energy mix assumptions based on largest production countries
pursuing country-level base case 2030 energy transition scenarios
towards renewable energy
Chemical use assumes ~15 percentage point reduction in chemical use
due to more efficient technology usage (e.g. washing machine with
spraying unit) with an adoption rate of ~5% across the industry
Accelerated abatement
Energy efficiency assumes ~5% energy consumption improvement for
spinning, weaving and knitting improvements adopted across the
industry; ~80% efficiency improvement in wet processing technology
towards dry technology (e.g. laser dyeing jeans) with an adoption
rate of +60%
Energy mix assumptions based on suppliers in largest production
countries pursuing 100% renewables energy transition, assisted by
brands and retailers, more swiftly than the country-level energy
transition
Chemical use assumes ~50% percentage point reduction in wet
processing due to new advanced Econtrol dyeing technologies and
bifunctional or polyfunctional dyes, with an adoption rate of 20%
across the industry
McKinsey: Global Energy Perspective,
2019; EnerData: Energy transition
scenario analysis, 2019; Palamutcu:
Electric energy consumption in the
cotton textile processing stages,
2010; Kant: Textile dyeing industry
and environmental hazards, 2012;
Institut für Textiltechnik: RWTH
Aachen University
Economics
Increased operating costs for renewables energy usage: assumes
additional costs related to battery storage and other renewables
infrastructure, despite price parity in most markets
Assumes capex expenses for weaving, knitting and spinning
improvements (e.g. improvements in ring spinning, humidification
plants) and wet processing (e.g. automatic steam control valves,
recovery of condensate in wet processing plants)
Hasanbeigi: Energy-efficiency
improvement opportunities for the
textile industry, 2010; Palamutcu:
Electric energy consumption in the
cotton textile processing stages,
2010; Institut für Textiltechnik:
RWTH Aachen University
3. DECARBONISED MATERIAL PROCESSING
LEVER NAME KEY ASSUMPTIONS SOURCES

35 — 52
4. Minimised production
wastage: Reducing waste
generated in the processing
stages
Current pace trajectory
Assumes marginal 1% improvement in the current ~3% wastage from
fibre to textile stage as the practice is already relatively
optimised Improved wastage collection rate +10% to avoid landfill
and incineration
Accelerated abatement
Assumes better incentivisation in production markets to increase
wastage collection rate by +30%
The Fiber Year Consulting: The
Fiber Year Report, 2019; Institut
für Textiltechnik: RWTH Aachen
University; expert input
Economics
Reduced operating costs due to less disposal or incineration and
savings from using less virgin fibre
Institut für Textiltechnik:
RWTH Aachen University; Reverse
resources: Creating a digitally
enhanced circular economy, 2017
4. MINIMISED PRODUCTION WASTAGE
LEVER NAME KEY ASSUMPTIONS SOURCES

36 — 52
5. Decarbonised garment
manufacturing: Improvements
in energy mix and efficiency
across garment manufacturing
countries
Current pace trajectory
Assumes ~30% reduction in energy consumption across heating,
ventilation and air conditioning (HVAC) technology, with +15%
adoption rate; ~80% energy improvement in lighting by switching to
LEDs, with +20% adoption rate; ~20% energy improvement in sewing
machines through new technology, with +10% adoption rate
Energy mix assumptions based on country-level base case 2030 energy
transition scenarios towards renewable energy
Accelerated abatement
Assumes +30% increase in adoption rate in HVAC efficiency
improvements, +40% increase in adoption rate of LEDs and +30%
increase in adoption rate of improved sewing machine technology due
to increased upfront funding support availability
Energy mix assumptions based on suppliers in production countries
pursuing 100% renewables energy, assisted by brands and retailers
U.S. Department of Energy: Office
of Scientific and Technical
Information, 2018; Selco
Foundation: Energy efficiency &
energy conservation measures for
sewing machines, 2017; Institut
für Textiltechnik: RWTH Aachen
University; EnerData: Energy
transition scenario analysis, 2019;
McKinsey: Global Energy Perspective,
2019
Economics
Reduced operating costs due to lower energy consumption; initial
capex needed for energy improvement measures for lighting, sewing
machine and HVAC solutions
Selco Foundation: Energy efficiency
& energy conservation measures
for sewing machines, 2017; U.S.
Department of Energy: Office
of Scientific and Technical
Information, 2018; Institut
für Textiltechnik: RWTH Aachen
University
5. DECARBONISED GARMENT MANUFACTURING
LEVER NAME KEY ASSUMPTIONS SOURCES

37 — 52
6. Minimised manufacturing
wastage: Reducing waste
generated in garment
manufacturing stage
Current pace trajectory
2 percentage point improvement in wastage rate (from ~14% today
to 12%) due to better designer education and modernised cutting
machines; +20% improvement in waste collection expected, preventing
landfilling or incineration; +5% improvement in closed-loop-
recycling (CLR) driven by advancements in sorting technology
Accelerated abatement
Assumes wastage limitation to unavoidable scrap only (~5%) through
better design and fabrics; +40% improvement in waste collection
assuming better training and incentivisation of factory employees;
+10% improvement in CLR driven by better incentivisation, along with
investment in textile blend identification and recycling technology
The Fiber Year Consulting: The
Fiber Year Report, 2019; Institut
für Textiltechnik: RWTH Aachen
University; expert input
Economics
Reduced operating costs due to less disposal and incineration
Institut für Textiltechnik: RWTH
Aachen University
6. MINIMISED MANUFACTURING WASTAGE
LEVER NAME KEY ASSUMPTIONS SOURCES

38 — 52
7. Increased use of
sustainable transport:
Changes in modes of
transportation and
improvements in fuel mix
Current pace trajectory
Transport mode mix assumes 2% shift in sea vs air transport,
resulting in 15% air and 85% sea transport due to increased
digitisation of value chain practices
Electrification assumes the EU and China continue to lead the
transition, driven by regulation in the form of emission targets
(EU) and subsidies (China), resulting in battery electric vehicles
(BEVs) making up to 5% of heavy-duty trucks (HDTs), 12% of medium-
duty trucks (MDTs) and 30% of light commercial vehicles (LCVs) used
in B2B and B2C transport91
Accelerated abatement
Transport mode mix assumes ~7% shift in sea vs. air transport,
resulting in 10% air, 90% sea transport through rapid digitisation
and investments in more demand-focused regional supply chains or
nearshoring
Electrification assumes ~90% of LCVs used in last mile will be
electrified and ~7% of HDTs and 17% of MDTs will be electrified due
to continued incentives and improved battery life and suitability
for heavy payloads
IHS Markit database, historical
data; McKinsey: Global Energy
Perspective, 2019; McKinsey: Center
for Future Mobility; expert input
Economics
Reduced operating costs due to shift from more expensive air
freight (4x) to sea freight and operational cost savings from
moving to BEVs (upfront capex assumes 5-year lifetime and ~40%
salvage value)
McKinsey: Center for Future
Mobility; expert input
7. INCREASED USE OF SUSTAINABLE TRANSPORT
LEVER NAME KEY ASSUMPTIONS SOURCES

39 — 52
8. Minimised packaging:
De-carbonisation through
material mix improvements
and minimised material usage
(manufacturing through retail
stages)
Current pace trajectory
Material mix assumes +10 percentage point increase in recycled
content usage in corrugated boxes and 50% recycled LDPE content in
polybags through increased brand commitments
Material usage assumes ~20% weight reduction in corrugated boxes
by reducing number of layers from five to four and the use of two
garments per polybag among ~40% of the market through improved
folding techniques
Accelerated abatement
Material mix assumes +20 percentage point increase in recycled
content usage in corrugated boxes and 80% recycled LDPE content in
polybags through improved material functionality and economics
Material usage assumes ~40% weight reduction in corrugated boxes
by reducing number of layers from five to three and the use of two
garments per polybag among ~80% of the market; reduction in polybag
weight by ~20% through improved material functionality
Ellen MacArthur Foundation: New
Plastics Economy Global Commitment
Report, 2019; Weideli: Environmental
analysis of US online shopping,
2013; expert input
Economics
Operational cost savings due to price of recycled vs. virgin
corrugated boxes and reduction in polybag usage
Expert input
8. MINIMISED PACKAGING
LEVER NAME KEY ASSUMPTIONS SOURCES

40 — 52
9. Decarbonised retail
operations: Improvements in
energy mix and efficiency
Current pace trajectory
Assumes ~40% reduction in energy consumption across HVAC due to
new technology, with +40% adoption rate; ~80% energy consumption
improvement by switching to LEDs, with +20% adoption rate
Energy mix assumptions based on country-level base case 2030 energy
transition scenarios towards renewable energy in key consumption
countries
Accelerated abatement
Assumes +70% increase in HVAC improvement adoption rate; +30%
LED lighting adoption rate due to increased brand awareness and
transparency
Energy mix assumptions based on 100% renewable energy usage by
brands and retailers
U.S. Department of Energy:
Office of Scientific and
Technical Information; Institut
für Textiltechnik: RWTH Aachen
University; EnerData: Energy
transition scenario analysis, 2019;
McKinsey: Global Energy Perspective,
2019
Economics
Reduced operating costs due to lower energy consumption; some
initial capex needed for energy improvement measures for lighting
and HVAC at stores, warehouses and distribution centres
U.S. Department of Energy:
Office of Scientific and
Technical Information; Institut
für Textiltechnik: RWTH Aachen
University
9. DECARBONISED RETAIL OPERATIONS
LEVER NAME KEY ASSUMPTIONS SOURCES

41 — 52
10. Minimised returns:
Decarbonisation by limiting
wastage due to retail returns
Current pace trajectory
Assumes a 5 percentage point improvement in e-commerce returns
rate (from 35% to 30%) based on technological improvements to
reduce returns due to size and fit issues; ~20% e-commerce share of
apparel today and ~45% in 2030; ~3-5% of returns are not fit for
resale
Accelerated abatement
Assumes a 20 percentage point improvement in e-commerce returns
rate (from 35% to 15%) based on a combination of technological
improvements on predicting size and fit and behaviour changes from
consumers to reduce purchases with intent to return
Shopify: The plague of ecommerce
return rates and how to maintain
profitability, 2019; Zalando:
Returns management case study, 2020;
expert input
Economics
Lower operating costs due to reduced waste, incineration and return
handling costs
Expert input
10. MINIMISED RETURNS
LEVER NAME KEY ASSUMPTIONS SOURCES

42 — 52
11. Minimised stock wastage:
Reducing waste generated due
to unsold retail stock
Current pace trajectory
Assumes 5 percentage point improvement in industry average
overproduction (from ~20% to ~15%), defined as unsold stock
following sales and discounts, due to investments in forecasting
technology and better production planning tools; 5 percentage point
improvement in (up/down/re)-cycling (from ~75% to ~80%) through
increased awareness; ~5 percentage point improvement in CLR from 1%
to 5% driven by advancements in sorting technology
Accelerated abatement
Assumes 10 percentage point improvement in overproduction (from ~20%
to ~10%) due to investments in more demand-focused supply chains
and forecasting technology; 10 percentage point improvement in (up/
down/re)-cycling (from ~75% to ~85%) through improved availability
of in-house recycling technology, reduced recycling costs and better
recycling journey transparency; ~10 percentage point improvement in
CLR from 1% to 10% through technology advancement in textile blend
identification and recycling technology
Ellen MacArthur Foundation, A New
Textile Economy, 2017; Netherlands
Ministry of Foreign Affairs Centre
for the Promotion of Imports from
Developing Countries: The European
market potential for recycled
fashion, 2020; expert input
Economics
Lower operating costs due to reduced overproduction and reduced
cost of stock disposal
Dotdash: The balance small business
website; Ellen MacArthur Foundation,
A New Textile Economy, 2017; expert
input
11. MINIMISED STOCK WASTAGE
LEVER NAME KEY ASSUMPTIONS SOURCES

43 — 52
12: Increased use of rental
models:
De-carbonisation through the
adoption of subscriptions or
one-time rental offerings
Current pace trajectory
Assumes growth in market share at ~11% CAGR to ~0.2% based on
recent growth in market share; the rental model extends product
life by 1.8x based on the average number of rentals during product
lifetime
Accelerated abatement
Assumes market share growth to ~3% based on increased adoption of
rental models among urban population; ~60% of population will be
based in urban areas, with ~25% willing to rent clothes and a ~1/3
intention-action gap among consumers
Business of Fashion: Luxury fashion
rental platform Armarium to cease
operations, 2020; Harvard Business
Review: The elusive green consumer,
2019; Westfield: How we shop,
2020; Oxford: Our world in data,
urbanization, 2019; expert input
Economics
Calculated based on two segments: luxury (60%) and mainstream
(40%), subscription based with monthly fees ranging from USD50–135
for 4-6 garments rented per month; assumes garments are rented
10-20 times in their lifetime before being discarded; analysis
considers two revenue streams: rental and subsequent sale of items;
~20% of garments assumed to be sold at 60% of their original price
following rental; key cost drivers include garment acquisition
(~20–25% of total costs), customer acquisition and retention (25-
40%) and transportation (5–15%)
Business of Fashion: Luxury fashion
rental platform Armarium to cease
operations, 2020; expert input
12. INCREASED USE OF RENTAL MODELS
LEVER NAME KEY ASSUMPTIONS SOURCES

44 — 52
13: Increased use of re-
commerce models: Promotion
of 2nd-hand sales (direct or
through platforms)
Current pace trajectory
Assumes growth in market share to ~9%, largely based on accelerated
growth expected in resale sub-segment vs. thrift sub-segment;
resale currently represents quarter of the size of thrift, however
growing ~5x faster; the analysis assumes re-commerce models to
extend average product life by 1.7x based on average length of
secondhand ownership
Accelerated abatement
Assumes market share growth to ~12% driven by increased willingness
of younger generations to purchase more re-commerce garments;
~48% of GenZ and Millennials and ~35% of GenX are willing to buy
secondhand, with a ~1/3 intention-action gap
Thredup: Resale Report, 2019; Cline:
The Conscious Closet, 2019; expert
input
Harvard Business Review: The elusive
green consumer, 2019; McKinsey:
Consumer Sentiment on Sustainability
and Fashion in the COVID Crisis,
2020
Economics
Calculated based on three segments: B2C (30%), P2P handling (35%),
P2P no handling (35%); assumes garments are sold at ~60% of their
original price; key cost drivers include garment acquisition (~30%
of total costs), handling and transportation
Rent the Runway: public data; expert
input
13. INCREASED USE OF RE-COMMERCE MODELS
LEVER NAME KEY ASSUMPTIONS SOURCES

45 — 52
14: Introduction of
refurbished / upcycled
products: Promotion of re-
furbished / upcycled product
offerings92
Current pace trajectory
Assumes growth in market share to ~0.1% based on ~10-15% of brands
offering refurbished products representing ~0.5-0.7% of their
total revenues; the analysis assumes double lifetime extension,
reflecting the professional, potentially brand-led upcycling
inherent to the process
Accelerated abatement
Assumes growth in market share to ~2% based on ~20% of players
increasingly using deadstock and overstock to develop refurbished
products; deadstock levels of ~15% with ~30% being refurbishable
and overstock levels of ~20% with ~25% being refurbishable
The Waste and Resources Action
Programme (WRAP), Evaluating the
financial viability and resource
implications for new business
models in the clothing sector, 2013;
University of Michigan case study:
Patagonia - encouraging customers
to buy used clothing, 2012, Eileen
Fisher: public data
McKinsey: Consumer Sentiment on
Sustainability and Fashion in the
COVID Crisis, 2020; expert input
Economics
Assumes refurbished items are sold at par with new items; key cost
drivers include labour costs (~50% of total costs)
Eileen Fisher: public data; expert
input
14. INTRODUCTION OF REFURBISHED / UPCYCLED PRODUCTS
LEVER NAME KEY ASSUMPTIONS SOURCES

46 — 52
15: Introduction of product
repair services:
Promotion of repair services
to extend product life
Current pace trajectory
Assumes repair model adoption is largely driven by home repairs
under current trajectory; repairs performed on garments within
select categories, e.g. outerwear, jeans, dresses, shirts and
suits; ~10% (~3 month) lifetime extension potential through home-
based repairs (e.g. sewing a button, removing a stain and repairing
a hem); ~60% of consumers willing to perform repairs, however, with
a ~1/3 intention-action gap
Accelerated abatement
Assumes wider availability of repair models through professional
repairs offered by brands and retailers; lifetime extension of ~35%
(~1 year) driven by professional repairs; 15-20% of brands offering
repair services on the selected categories of garments
The Waste and Resources Action
Programme (WRAP): Valuing our
clothes, 2017; Harvard Business
Review: The elusive green consumer,
2019; expert input
The Waste and Resources Action
Programme (WRAP): Valuing our
clothes, 2017; expert input
Economics
Assumes the categories selected for repair are on average ~20-30%
more expensive vs. average garments, depending on the category;
key costs involve labour for repairing (~40-50% of costs),
transportation, material and handling costs
Expert input
15. INTRODUCTION OF PRODUCT REPAIR SERVICES
LEVER NAME KEY ASSUMPTIONS SOURCES

47 — 52
16: Reduced washing and
drying: Decarbonisation
through reduced washes and
improved care during the use
phase
Current pace trajectory
Assumes consumer awareness driven improvements across washing and
drying behaviours, largely in Western countries; ~10% reduction in
washing per kg of clothes, driven by behavioural changes; better
temperature selection driving ~5 percentage point improvement
in cold wash (below 300C) selection (from ~25% to ~30%); +10
percentage point improvement in average load size; ~2 percentage
point reduction in average dryer usage driven by reduction in US
consumer behaviour towards combination dryer or air dryer usage;
does not include ironing-related emissions
Accelerated abatement
Assumes accelerated consumer awareness and associated changes in
behaviour across major consumption markets; ~15% reduction in
washing per kg of clothes, driven by Asian consumers (currently the
highest washing frequency); ~25 percentage point improvement in
cold wash selection; +10 percentage point improvement in average
load size (washes at ~80% appliance capacity); +5 percentage point
improvement in dryer usage; does not include ironing related
emissions
Wilson College of Textiles:
Quantifying apparel consumer
use behaviour in six countries,
2019; Biointelligence Service:
Environmental improvement potential
of textiles, 2009; Procter & Gamble:
Sustainability Report, 2013; The
Waste and Resources Action Programme
(WRAP): A carbon footprint for UK
clothing and opportunities for
savings, 2012; Laitala: A literature
review for life cycle assessment,
2017
Economics
Reduced energy costs due to reduced washer and dryer usage
The Waste and Resources Action
Programme (WRAP): A Carbon footprint
for UK clothing and opportunities
for savings, 2012; Wilson College
of Textiles: Quantifying apparel
consumer use behaviour in six
countries, 2019; McKinsey: Energy
Insights team
16. REDUCED WASHING AND DRYING
LEVER NAME KEY ASSUMPTIONS SOURCES

48 — 52
17. Increased recycling &
collections: Decarbonisation
through increased recycling
and minimised incineration
without recovery and landfill
Current pace trajectory
Assumes +8 percentage point improvement in post-consumer garment
recycling rate (from ~17% today) through continued technology
investments and innovation; +5% improvement in CLR driven by
advancements in sorting technology
Accelerated abatement
Assumes ~30-40% post-consumer garments will be recycled through
a combination of changing attitudes, improved recycling
infrastructure and textile waste-related regulations; +10%
improvement in CLR driven by better incentivisation along with
investment in textile blend identification and recycling technology
Ellen MacArthur Foundation, A New
Textile Economy, 2017; Netherlands
Ministry of Foreign Affairs Centre
for the Promotion of Imports from
Developing Countries: The European
market potential for recycled
fashion, 2020; European Commission:
EU waste management and recycling
regulation, 2008; expert input
Economics
Assumes additional cost impact due to upfront capex related to
collection infrastructure, e.g. collecting bins, sorting or
recycling machines and associated labour costs
Institut für Textiltechnik: RWTH
Aachen University; Wittmann
Recycling, used clothing containers
and textile recycling, 2020
17. INCREASED RECYCLING & COLLECTIONS
LEVER NAME KEY ASSUMPTIONS SOURCES

49 — 52
ENDNOTES
1 Signed in 2016 the UNFCCC Paris Climate Change
Agreement deals with greenhouse gas emissions
mitigation, adaptation and finance. Its long-
term goal is to keep the increase in global
average temperature to well below 2°C above pre-
industrial levels and to pursue efforts to limit
the increase to 1.5°C
2 TheScience Based Targetsinitiative is a
partnership between CDP, UN Global Compact, WRI
and WWF that provides companies with a clearly
defined pathway to future-proof growthby
specifying how much and how quickly they need to
reduce their GHG emissions
3 Based on the science-based targets initiative
website data; companies filtered for “textiles,
apparel, luxury goods”, June 2020
4 Existing estimates indicate that the fashion
industry contributes between 3% and 10% of
global emissions
5 Friday’s for Future is an international movement
of school students who take time off from class
on Fridays to participate in demonstrations to
demand action from political leaders to take
action to prevent climate change
6 Consumer sentiment on sustainability and fashion
in the COVID-19 crisis, McKinsey, May 2020
7 Consumer sentiment on sustainability and fashion
in the COVID-19 crisis, McKinsey, May 2020;
Annual earth day survey, Kearney, April 2020
8 Participant poll: GFA – McKinsey ‘Sustainability
in Fashion’ Apparel, Fashion & Luxury Executive
Webinar, n >300, June 2020
9 Europeans make record investments in sustainable
funds, Financial Times, January 2020
10 European Commission: EU budget powering the
Recovery Plan for Europe, May 2020
11 Taiyang News: Renewables find mention in
COVID-19 economic Stimulus package of Japanese
government; April 2020
12 All mentions of GHG emissions in this report are
shown in CO2 equivalent (CO2eq) metric. This
is used to compare the emissions from various
GHG based on their global warming potential
by converting amounts of other gases to the
equivalent amount of carbon dioxide with the
same global warming impact
13 NASA GISTEMP (2019) and Nathan J. L. Lenssen et
al., “Improvements in the GISTEMP uncertainty
model,” Journal of Geophysical Resources:
Atmospheres, June 2019, 124(12)
14 Climate risk and response: Physical hazards and
socioeconomic impacts, McKinsey, January 2020
15 See appendix: Methodology, acknowledgements and
endnotes for further details on the bottom-up
calculation of the industry baseline
16 Oxford University: Our World in Data, using
emissions data from the global carbon project.
Refers to 2017 CO2 emissions figures from the UK
(0.5Bn tonnes), Germany (1.1Bn tonnes), France
(0.5Bn tonnes), converted to CO2 equivalent
units and scaled-up to 2018 using the population
growth rate from the World Bank
17 Based on annualized emissions baseline analysis,
use phase would represent a larger share in
lifecycle assessment analysis
18 See appendix: Methodology, acknowledgements and
endnotes for further details on industry growth
analysis and no-further-action analysis
19 See appendix: Methodology, acknowledgements and
endnotes for further details on current pace
trajectory
20 See endnote 1
21 See appendix: Methodology, acknowledgements and
endnotes for further details on accelerated
abatement
22 Throughout this report, we refer to the
additional abatement needed for the industry
to reach the 1.5-degree pathway as accelerated
abatement, which refers to the industry
accelerating beyond its current abatement
trajectory to meet the 1.5-degree target in 2030
23 See appendix: Methodology, acknowledgements and
endnotes for further details on industry cost
curve analysis
24 Analysis based on fashion industry cost curve
(see appendix: Methodology, acknowledgements and
endnotes), looks at the societal benefit of the
analysed decarbonisation levers, which means
it is not a view on financial impact from the
stakeholder point of view

50 — 52
25 Policy Hub – Circularity for Apparel and
Footwear: Recommendations for Green Recovery
in the European Apparel and Footwear Industry,
June 2020. The Policy Hub is a collaborative
effort between Sustainable Apparel Coalition,
Federation of the European Sporting Goods
Industry and Global Fashion Agenda
26 Further details on calculation methodology in
the deep-dive box
27 See endnote 16
28 Includes raw material cultivation and extraction
as well as yarn/fabric preparation and wet
processing stages
29 This is an annualised emissions analysis, not
a lifecycle analysis of a garment; as a result
the usage-phase emissions differ vs. lifecycle
analysis results
30 Fibre volumes based on the Fiber Year
Report, Material specific emissions based on
multiple sources, see appendix: Methodology,
acknowledgements and endnotes
31 Top production countries include: China,
Bangladesh, Vietnam, Turkey and India; major
consumption countries include US and EU; UN
Comtrade: Imports and exports of apparel
industry, 2019
32 We use this as the analytical starting point for
2030 emissions for both the current trajectory
and accelerated abatement scenarios. No further
action therefore represents the emissions level
due to industry growth assuming no further
action is taken
33 Post COVID-19 growth scenarios are based on
Apparel Fashion & Luxury sector, McKinsey Global
Institute analysis. The analysis is based on the
“virus contained, growth rebound” scenario and an
implied industry CAGR of 2% per annum till 2030.
See appendix: Methodology, acknowledgements and
endnotes for further details
34 See appendix: Methodology, acknowledgements
and endnotes for assumptions on each of the
levers analysed
35 The 1.1 billion tonne target was calculated
based on the 1.5-degree IPCC report scenario
and our bottom-up calculation of the fashion
industry’s share in global emissions, see
appendix: Methodology, acknowledgements and
endnotes on calculation of 1.5-degree target for
the fashion industry
36 See appendix: Methodology, acknowledgements and
endnotes for further details
37 The total required abatement is calculated from
the no-further-action emissions level, as the
2030 emissions abatement is based on a set of
assumptions around the levers, which may
not materialise
38 See appendix: Methodology, acknowledgements and
endnotes for a full list of the abatement levers
analysed and the assumptions behind accelerated
abatement scenario calculations
39 Targeted spreading is the targeted application
of fertilisers and pesticides, which increases
spraying efficiency to reduce the amount
of spillage
40 Such as laser technology and dry chemical dying
processes replacing wet processing
41 Such as machines with spraying units to optimise
dying processes, automatic steam control and
recovery of condensate in wet processing
42 Assumes brand-led support to implement on-
site renewable generation, on-site and off-site
corporate power purchase agreements and Energy
Attribute Certificates, in addition to ongoing
country-level transitions to renewable energy; see
energy transition deep dive for further details
43 Marginal improvements expected in fibre-to-
textile production phase as the lever is
already relatively well optimised (current
industry average is around 3% wastage), with
widespread usage of defect tracking and wastage
reduction systems. Improvements largely expected
in cutting waste improvement in the garment
manufacturing stage (current industry average is
around 14%)
44 HVAC and lighting represent ~70% of energy
consumption in manufacturing, and sewing
machines consume ~20% of energy. Jananthan:
Comparative study of energy assessment from
apparel industries, 2006
45 See energy transition deep dive for further details
46 A coalition of 240+ leading companies committed
to using 100 % renewable electricity
ENDNOTES

51 — 52
ENDNOTES
47 Currently estimated to be ~83% sea transport
and ~17% air transport across the value chain
Calculated assuming an air-freight CAGR of 5.5%
p.a. on the 2014 baseline (92/8 sea vs. air split)
from EU Commission. EU Commission: Environmental
improvement potential of textiles, 2014; Maritime
Executive: Global Freight demand, May 2019
48 The practice of transferring operations closer to
consumption countries. Popular nearshore markets
include countries in the Americas, Turkey and
Eastern Europe; McKinsey & Company: Is apparel
manufacturing coming home?, October 2018
49 52% of returns are due to size/fit concerns;
Shopify: Return Magic survey, N>800,000 Shopify
customers, 2017; Zalando: Returns management
case study, 2020
50 Edited.com 2019 analysis of share of product
offering sold at a discount
51 Defined as the level of stock that is unsold
following sales and discounts
52 In 2019 France introduced a ban on the
destruction of unsold fashion goods, to be
implemented by 2023, which prohibits discarding
unsold products that are non-perishable, such
as apparel and footwear. http://www.assemblee-
nationale.fr/dyn/15/dossiers/lutte_gaspillage_
economie_circulaire
53 University of California, Santa Barbara:
Reducing greenhouse gas emissions through
materials innovation in the apparel
industry,2019
54 Textile Exchange: Preferred Fibre and Materials
Market Report, 2017
55 Modal and Lyocell could potentially be produced
with up to 50% less emissions than generic
viscose. Lenzing Group: Sustainability Report,
2019; C&A Foundation
56 Citi Research: Global Apparel Retail -
Sustainability to challenge the fashion world
order, January 2020
57 Circular business models extend product life
and therefore reduce the need for new resources
in producing virgin materials. Refer to the
appendix: Methodology, acknowledgements and
endnotes on the replacement rates assumed for
garment in circular models
58 Ellen MacArthur Foundation: A new textile
economy, 2017
59 Calculated based on ThredUp 2019 Resale report
market values for 2018, adjusted for the US
share of the total apparel market
60 Compound annual growth rate
61 ThredUp: Resale market report, 2019
62 60% of the Gen-Z and Millennial population is
assumed to be based in urban areas, with 25% of
them indicating a willingness to rent clothes.
Westfield: How we shop, 2020; Oxford: Our World
in Data, Urbanization, 2019
63 GFA survey on deadstock and overstock during
COVID-19 crisis, N=24, April 2020
64 C ategories include outerwear, jeans, dresses,
shirts and suits
65 WRAP: Valuing our clothes, 2017
66 Elizabeth Cline: The conscious closet, 2019
67 Expert input from rental model executives
68 WRAP, Valuing our clothes, 2017; expert input
from circularity experts and repair business
executives
69 Costs do not include transaction costs,
subsidies or explicit CO2 costs, taxes or
consequential impact on the economy (e.g.
advantages from technology leadership).
70 Based on expert input on decarbonisation pathway
and the economics of industry-level cost curves
71 EU Directive on waste, May 2018 https://
eur-lex.europa.eu/legal-content/EN/TXT/
PDF/?uri=CELEX:32018L0851&from=EN
72 McKinsey & Company: Consumer sentiment on
sustainability and fashion in the COVID-19
crisis, May 2020
73 See endnote 1
74 For example, the Higg Tools from the Sustainable
Apparel Coalition
75 Consumer sentiment on sustainability and fashion
in the COVID-19 crisis, McKinsey & Company, May
2020
76 Higg Facility Tools by the Sustainable Apparel
Coalition for measuring the social and
environmental performance of their facilities

52 — 52
ENDNOTES
77 European Commission: EU Green Deal
communication, December 2019 https://eur-lex.
europa.eu/resource.html?uri=cellar:b828d165-
1c22-11ea-8c1f-01aa75ed71a1.0002.02/
DOC_1&format=PDF
78 French National Assembly: Law on Circular
Economy and the Fight Against Waste 2020,
http://www.assemblee-nationale.fr/dyn/15/
dossiers/lutte_gaspillage_economie_circulaire
79 European Commission, Circular Economy Action
Plan, 2020 https://ec.europa.eu/environment/
circular-economy/pdf/new_circular_economy_
action_plan.pdf
80 UNFCCC COP25 Communique: Fashion Industry
Invites Governments to Collaborate on Climate
Action https://unfccc.int/climate-action/
sectoral-engagement/global-climate-action-in-
fashion/fashion-industry-charter-for-climate-
action/communique-fashion-industry-invites-
governments-to-collaborate-on-climate-action
81 McKinsey & Company: Why ESG is here to stay, May
2020
82 Financial Times: Companies with strong ESG
scores outperform, study finds, August 2018
83 Includes recycled materials or innovative
materials with low emissions or other
sustainability dimension impact
84 McKinsey & Company: Why ESG is here to stay, May
2020
85 UN Comtrade Database, filtered for ‘textiles;
worn clothing and other worn articles’ and
‘articles of apparel and clothing accessories,
of leather or of composition leather’, 2018
86 UN Comtrade Database, filtered for ‘textiles;
worn clothing and other worn articles’ and
‘articles of apparel and clothing accessories,
of leather or of composition leather’, 2018
87 The Fiber Year Consulting: The Fiber Year
Report, 2019
88 Apparel assumed to represent ~82% combined
apparel and footwear industry emissions based on
Quantis: Measuring Fashion Report 2018
89 IPCC: Global warming of 1.5°C, 2018
90 4% share of apparel and footwear emissions in
global emissions is based on the bottom-up
calculation of fashion industry GHG footprint
91 Weight class definitions: US: Heavy-duty trucks
(HDT): class 8 (>15t), Medium-duty trucks (MDT):
class 4-7 (6-15t); Light commercial vehicles
(LCV): class 1-3 (<6t), excluding pick-up trucks
below 3.5t; EU: HDT >16t, MDT: 7.5-16t, LCV:
<7.5t; CN: HDT >14t, MDT: 6-14t, LCV: <6t – does
not include buses
92 Upcycling goes beyond simple enhancements like
adding a patch/personalisation